When the network doesn't respond, will you wait forever, blocking the app (and your users), sacrificing availability? Or will you make up an answer (show inconsistent data)?
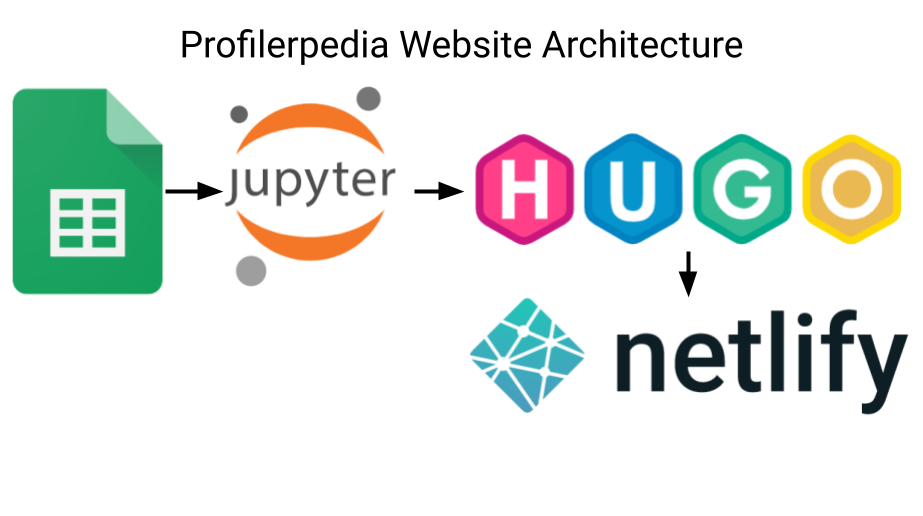
Here’s how I built a website, Profilerpedia, using a Google Sheet as the backing database.
Profilerpedia aims to map the profiling ecosystem and connect software with profilers and profilers with great analysis
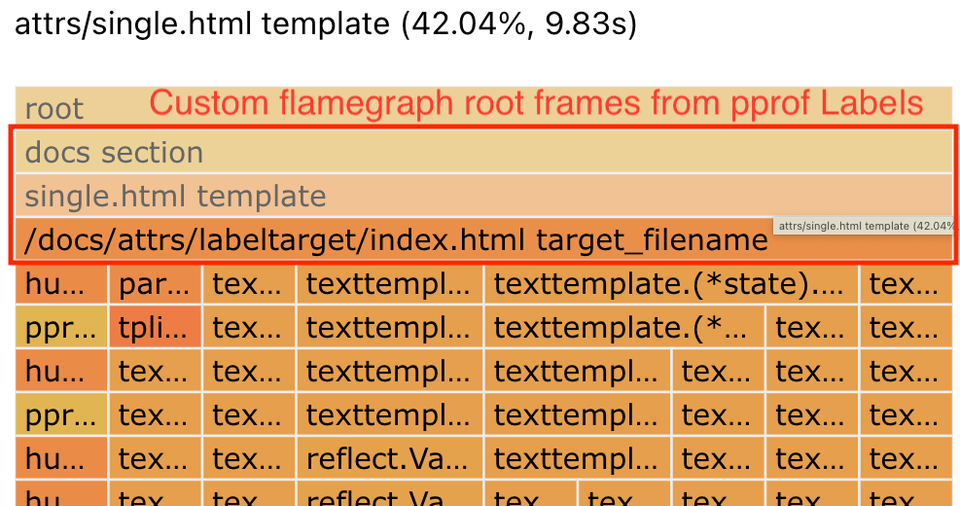
pprof -tagroot lets you break down & visualise pprof software profiles by custom, domain-specific key-value pairs (Labels, aka Tags) attached to each stack sample.