Run a website off a Google Sheets Database, with Hugo
Here’s how I built a website, Profilerpedia, using a Google Sheet as the backing database.
Profilerpedia aims to map the profiling ecosystem and connect software with profilers and profilers with great analysis UIs, so we can make code faster and more efficient. More on Profilerpedia in the announcement post.
It’s interesting to explain the architecture, because it challenges some engineering dogmas, like “a spreadsheet isn’t a good database”. I think running your site from a spreadsheet is a very reasonable pattern for many sites.
The resulting architecture is my third or fourth attempt at this; I learned a lot along the way, I’m pretty happy with the result, and I want to share what I learned.
My Requirements
All software engineering is about solving a problem. Each problem is different, and this approach might not work for you if your requirements are not the same as mine!
- Low fuss: this is a side project, I don’t want to sysadmin, monitor, upgrade things, or scramble if the site goes viral. Mostly, this implies compiling to static HTML.
- Cheap. It’s a side project, I don’t want to pay big monthly costs.
- Demonstrate value quickly: i.e. Scale from zero. We shouldn’t have to wait a long time to be able to share the research with collaborators.
- UI should be mobile-friendly; that’s where most of the users will find the site if it gets popular, on their phones checking Twitter.
- Be able to get feedback from collaborators.
- Capture data quickly as I’m doing research.
- Should be easy to add new data if a new profiler comes out.
- Profilers should hyperlink to their output data formats, and data formats to their analysis UIs, and vice-versa.
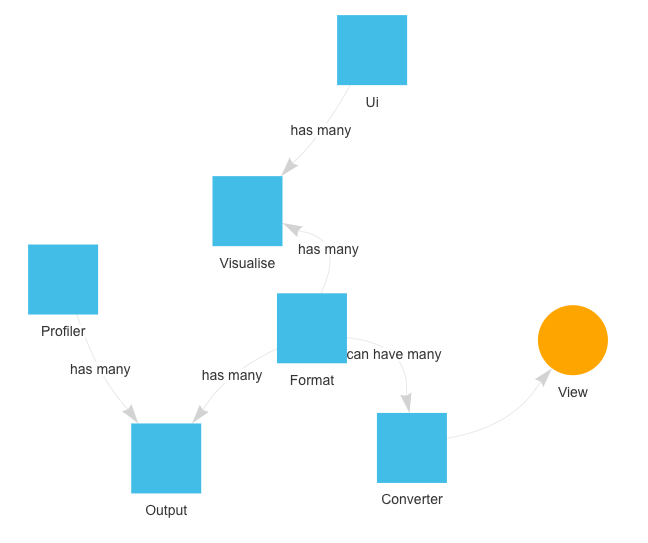
- End Goal: visualise directed graphs of relationships between profilers, data formats, converters, and UIs.
- A few hundred rows in each table. This is important: the site doesn’t handle huge amounts of data.
- Few writers, many readers.
- Not real-time: the site doesn’t have to update in real time. It’s OK if the site takes a while to update after writing.
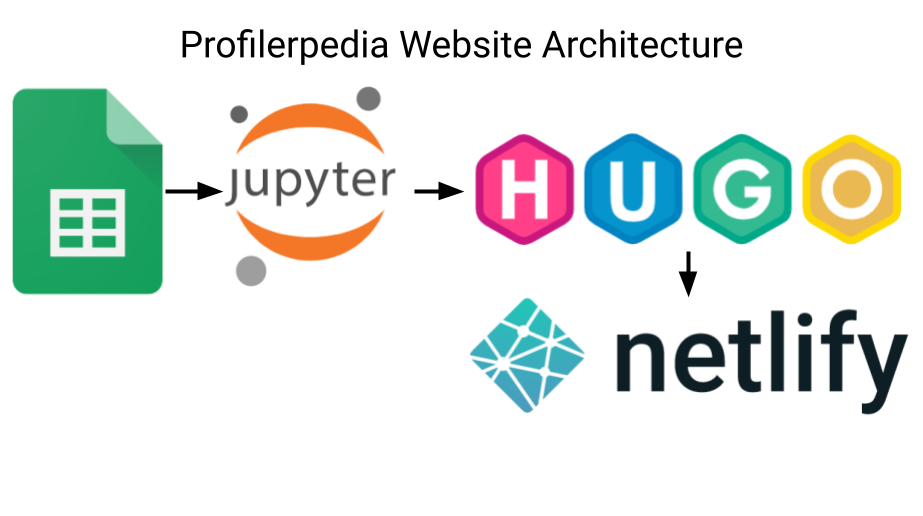
High-level Architecture
- Data is stored in a A Google Sheet. (Heresy 1)
- The Google Sheet has 6 tables, storing data and relationships in normalised form.
- Google Sheets exposes the data as CSVs with the Google Charts CSV API, which minimises API Key & parsing fuss.
- A Jupyter Notebook (Heresy 2) reads the CSVs into data frames using the Pandas Dataframe library.
- The Jupyter notebook loops over the tables, generating Hugo content files.
- Hugo compiles the site, using the Docsy technical documentation theme.
- Netlify initialises Docsy, runs the Jupyter notebook to pull the latest changes from the spreadsheet, then runs Hugo to compile the site, whenever I push to Git or press a button, running:
git submodule update —init —recursive \
  && jupyter nbconvert —to notebook —inplace —execute Generate.ipynb \
  && hugo
Spreadsheet as Database? Heresy!
It’s common for developers to scoff, or react in horror, at systems using a spreadsheet as a database.
The prevailing wisdom is that websites should be built on top of ‘real databases’: MySQL, PostgreSQL, etc. Or at worst, built from files stored in version control.
It’s heretical, but Google Sheets has a lot of advantages as a database:
- Great data entry UI. You don’t need to build an admin interface. There’s even a mobile app.
- Google Forms can add rows to the database in a structured format.
- Comments built-in. Comments allow inline discussion of data and suggestions.
- Share with collaborators (auth built in).
- Public read-only preview. This allowed me to share the database with collaborators and get feedback, even before building a website on top of it. This lets you test your ideas quicker.
- Data access APIs (more on this later).
- Fully managed database service: you don’t have to monitor or upgrade the database.
- Schema migrations are as simple as adding a column (as long as your downstream code keys off column name, not index!)
- A functional-reactive programming model lets you build columns from other columns quickly.
- Conditional formatting!
Of course, you should balance these with the very real disadvantages:
- Cells are “stringly-typed”
- There are no foreign key constraints
- It’s easy to corrupt your data
- You won’t be able to support many concurrent writers
- There are API limits on spreadsheets if you want to serve the data directly from the spreadsheet, and if you cache the data, then it will get stale.
Overall, it’s somewhat similar to the tradeoffs of a schemaless document/NoSQL database vs a schema/SQL database. Use the appropriate tool for the job.
Deploying a Notebook to Production? Heresy!
The conventional wisdom is that you can’t, shouldn’t deploy a Jupyter notebook to production. That instead you should extract your code to .py files and run those. Generally, this is probably good advice. But in this situation, there are serious benefits to the notebook format: interactive visualisation of the output as you run specific cells lets me quickly iterate on a specific bit of code. Jupyter has great rendering of Pandas dataframes. And the downsides (e.g. lack of testing) can be handled downstream after the site is compiled, or never, if the site just isn’t that important (mine isn’t).
Here’s how you execute an entire notebook:
$ jupyter nbconvert —to notebook —inplace —execute profilerpedia.ipynb
I commit the Jupyter Notebook file to Git, and Netlify is happy to execute it.
Normalising data in Google Sheets like it’s a SQL Database
This is not a heresy, this is a best practice 😃.
The normal forms are still useful even if you’re storing your data in Google Sheets. You can apply the usual SQL idioms for representing linkages in data: foreign keys, and relationship tables for many:many relationships.
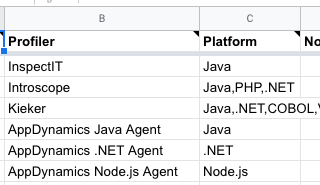
Profilerpedia stores data is stored in 6 tables (Google Sheets tabs):
Profilers Table
- Name
- Docs Link
- Target Platform (e.g. C, C++, Rust, Go…)
Formats Table
- Name
- Docs Link
- Schema Link
UIs Table
- Name
- Docs Link
- UI Platform (e.g. Browser, GTK, Windows…)
Converters Table
(relationship table; many:many, Formats ➡️ Formats)
- Docs Link
- From Format ID
- To Format ID
Outputs Table
(relationship table; many:many, Profilers ➡️ Formats)
- Profiler ID
- Format ID
Visualises Table
(relationship table; many:many, Formats ➡️ UIs)
- Format ID
- UI ID
Emulating Foreign Key Checking in Google Sheets
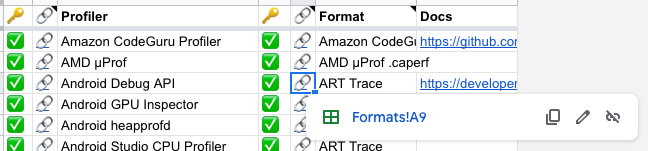
I found myself missing the comfort of some static checks that a foreign key link actually exists in the other table, so I built a foreign key checker into Google Sheets. This was a bit harder than I expected: there are many lookup and query functions, and many pitfalls.
I added a column called “🔑” that was a “✅” if the referenced key exists in the other table, otherwise a “❌”.
Example formula from Example Formula from Outputs Table:=IF(ISBLANK(F3),,IF(ISNA(FILTER(Formats!B:B,Formats!B:B=F3)), “❌”, “✅”))
This caught a bunch of typos as I was entering IDs.
Generating Hugo Content Files
The Jupyter notebook generates Hugo content files (HTML with JSON/YAML/TOML front-matter) which Hugo then merges with an HTML layout to generate an HTML page per content file. For example, for [the austin2pprof converter (austin2pprof | Profilerpedia), the notebook outputs content/en/austin2pprof.html:
{
  "converts_from": {
    "name": "Austin",
    "slug": "austin"
  },
  "converts_to": {
    "name": "pprof",
    "slug": "pprof"
  },
  "docs": "https://github.com/p403n1x87/austin#google-pprof",
  "note": "Austin format is really just folded stacks",
  "slug": "austin2pprof",
  "title": "austin2pprof"
}
JSON was the easiest format to programatically output for the front-matter, YAML and TOML are harder to output, and I’m not editing the output manually or adding comments, so JSON works great.
I was careful to try to avoid path traversal in case someone adds an output filename like /etc/passwd or ../../../etc/passwd.
I also used https://github.com/tqdm/tqdm to render a progress bar.
for converter in tqdm(converters.itertuples(), total=converters.shape[0]):
    base = os.path.realpath("content/en/converters/")
    path = os.path.realpath(base + "/" + converter.Slug)
    if not converter.Slug:
        continue
    # Avoid path traversal
    commonpath = os.path.commonprefix((path, base))
    if commonpath != base:
        raise Exception("Bad path %s: common path=%s" % (path, commonpath))
    with open(path + ".html", "w") as f:
        json.dump(
            {
                "title": converter.Converter,
                "docs": converter.Docs,
                "note": converter.Note,
                "converts_from": {
                    "slug": args["formats_by_name"][converter.From].Slug,
                    "name": converter.From,
                },
                "converts_to": {
                    "slug": args["formats_by_name"][converter.To].Slug,
                    "name": converter.To,
                },
                "slug": converter.Slug,
            },
            fp=f,
            indent=2,
            sort_keys=True
        )
        # Need a newline for Hugo to recognise JSON front matter
        f.write("\n")
See more examples at profilerpedia/Generate.ipynb.
Hugo Templates
I made a Hugo layout template for each ‘section’ of page, which renders the JSON above into HTML, e.g. converters/content.html:
{{ with .Params.docs }}
  <p><a href="{{ . }}">Docs</a></p>
{{ end }}
{{ with .Params.note }}
  <p>{{ . }}</p>
{{ end }}
{{ with .Params.converts_from }}
  <p>Converts From: <a href="/formats/{{ .slug }}/">{{ .name }}</a></p>
{{ end}}
{{ with .Params.converts_to }}
  <p>Converts To: <a href="/formats/{{ .slug }}/">{{ .name }}</a></p>
{{ end}}
<p><object class="graphviz" type="image/svg+xml" data="/converters/{{ .Params.slug }}.dot.svg"></object></p>
Similar templates exist for Profilers, Analysis UIs, and Data Formats.
Tags / Taxonomies
I added tags to each page (e.g. which languages a profiler targets) by having a Column full of comma-separated values (classic spreadsheet hack to represent multiple fields inside a cell!)
Then in the Jupyter notebook I split that CSV and add them as Hugo Taxonomies. Docsy then renders them nicely as a tag cloud, letting you find profilers for a given language:
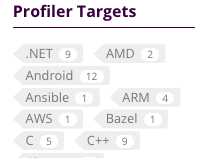
And a page listing all profilers, for, say: C++ | Profilerpedia.
This was flexible and makes it easy to add tags just by adding more columns; I’ll probably add some more tags in future e.g. for Tracers vs Sampling Profilers, and whether the profiler is obsolete.
Building on Netlify
I’d never used Netlify. I’ve mostly used GitHub Pages & GitLab Pages, but I’d heard good things about Netlify, so I thought I’d try them for this project. I’m really happy with Netlify — in particular, they auto-cache a lot, so the builds are very fast. Way faster than my local laptop (maybe it’s time for an upgrade). And it’s free up to 100GB / 300 build-time-minutes.
However, the configuration took a bit of iteration to figure out, I log it here in the hope that it’ll save people time.
To build Docsy and Hugo, I needed to specify in netlify.toml to initialise Docsy’s submodules, run hugo, and deploy from the public folder, and specify the HUGO_VERSION:
[build]
  # Simplified (skips the Juptyer notebook step):
  command = "git submodule update --init --recursive && hugo"
  publish = "public"

[build.environment]
  HUGO_VERSION = "0.88.1"
And Docsy depends on a few npm modules, so I had to add a package.json for Netlify to install:
{
  "devDependencies": {
    "autoprefixer": "^10.3.7",
    "postcss": "^8.3.11",
    "postcss-cli": "^9.0.1"
  }
}
To run the Jupyter notebook on Netlify, I had to specify a Python runtime in runtime.txt:
3.8
And specify version dependencies in requirements.txt:
...
jupyter==1.0.0
...
Failed Attempts Before this Architecture
It wasn’t all smooth sailing. Here’s some prior attempts that didn’t work out. Real-world architecture is messy, and often comes after a few exploratory failures, rather than fully-formed as a design doc.
Using the Google Sheets OAuth API
Sheets API. This seemed like the logical, production API to use. But this was so much harder than just querying the unofficial/undocumented Google Charts API, that I gave up on it.
Using Go instead of Python + Jupyter + Pandas
Go is the usual language I reach for when I want to move quickly and write code that’ll keep working long-term (because it handles errors). Go had a library for the Google Sheets API.
I started using Go to pull down data from the spreadsheet, but found myself wasting time mapping the spreadsheet to typed structs (basically doing object-relational mapping), and parsing the APIs myself:
type Format struct {
	name         string
	projectSite  string
	notes        string
	timestamping string
	fileFormat   string
	schema       string
}

func (c *ppClient) getFormatsTable() ([]*Format, error) {
	var formats []*Format
	resp, err := c.readRange("Formats!A:G")
	if err != nil {
		return nil, err
	}
	for _, row := range resp {
		// Print columns A and E, which correspond to indices 0 and 4.
		format := &Format{
			name:         row[1].(string),
			projectSite:  row[2].(string),
			notes:        row[3].(string),
			timestamping: row[4].(string),
			fileFormat:   row[5].(string),
			schema:       row[6].(string),
		}
		formats = append(formats, format)
	}
	return formats, nil
}
I had to do this for every table, and this was one of the simpler ones. Worse, it was fragile, depending on the columns ordering.
It also required screwing around with API keys:
func main() {
	apiKey := os.Getenv("SHEETS_API_KEY")
	if apiKey == "" {
		log.Fatal("SHEETS_API_KEY environment variable required.")
	}
	ctx := context.Background()

	srv, err := sheets.NewService(ctx, option.WithAPIKey(apiKey))
	if err != nil {
		log.Fatalf("Unable to retrieve Sheets client: %v", err)
	}
	ppClient := &ppClient{
		srv:           srv,
		spreadsheetId: "1cVcHofphkQqk1yGeuBPVTit8HQ0oa5SlRM6gkHIagtw",
	}
It was a waste of time doing this low-level work. Pandas data frame library was able to load a CSV, and key it by column and row in one line, and has built-in conversions to get each item as a struct.
With Pandas and the Google Charts API I could fetch all these tables with just 8 lines of code:
def read_sheet(sheet, **kwargs):
    return pd.read_csv(f"https://docs.google.com/spreadsheets/d/1cVcHofphkQqk1yGeuBPVTit8HQ0oa5SlRM6gkHIagtw/gviz/tq?tqx=out:csv&sheet={sheet}", **kwargs)

profilers = read_sheet("Profilers", index_col="Profiler", na_filter=False).sort_index(key=lambda x: x.str.lower())
formats = read_sheet("Formats", index_col="Name", na_filter=False).sort_index(key=lambda x: x.str.lower())
outputs = read_sheet("Outputs", na_filter=False)
converters = read_sheet("Converters", na_filter=False)
visualises = read_sheet("Visualises", na_filter=False)
uis = read_sheet("UIs", index_col="UI", na_filter=False).sort_index(key=lambda x: x.str.lower())
Shipping the Spreadsheet as the UI
I tried to only have the spreadsheet as the UI, with the links in the spreadsheet jumping from cell to cell.
I tried to build links into the spreadsheet to jump from Profilers, to their formats, to their UIs.
This worked OK for 1:1 relationships where each cell has only one hyperlink, like:=HYPERLINK(CONCAT(“#gid=0&range=A",”match(F19,Formats!B:B,0)), "Link")”
But failed when I wanted to link 1:many relationships with many hyperlinks per cell.
Despite Google Sheets supporting substring hyperlinks, and many hyperlinks per line, this only seems to work if you manually enter text. You can’t join together multiple hyperlinks using a formula.
I tried, with Formulae like JOIN(“,”, HYPERLINK(…)), but it couldn’t join the multiple hyperlinks together. It’s a shame.
Building the UI in Jinja2
My first attempt at making a website was looping over the data using Jinja2 Python HTML templates. It worked well for getting something running quickly, but the output didn’t look very nice, and I didn’t want to spend time styling it; I wanted the styling and search that Docsy can provide. So I migrated from Jinja2 to Hugo+Docsy.
Building a website + App with AppSheet
AppSheet looked really promising: a no-code UI solution that generates a mobile app and mobile-friendly website from data stored in a spreadsheet. I’d recommend it if you are solving a business problem with a budget.
I spent an afternoon getting Profilerpedia working as an AppSheet, and it was nice, with links back and forth from all the foreign keys.
But then I shared the site on Twitter, and it hit the daily AppSheet limit, where they thought a few people are using the site so I must be a business user, and able to pay business monthly rates. A shame there’s no wider personal plan for slapping a read-only on a spreadsheet. You can try seeing the site it generated, but it might be down now 😁.
I would recommend AppSheet for solving a business problem where you have budget though, it was so quick to prototype.
Conclusion
- Google Sheets can be a great database to drive your website.
- Jupyter Notebook is good for iteration and you can also deploy from it.
- Docsy is a great theme for making technical documentation look great.


Comments ()