pprof -tagroot: Custom Labels in Go Flamegraphs
This post describes a new pprof feature I just landed.
pprof -tagroot lets you break down pprof software profiles by domain-specific key-value pairs (Labels, aka Tags) attached to each stack sample.
e.g. on a pprof profile with http_route and user_id labels, this command:
$ pprof -tagroot http_route,user_id input_profile.pprofinserts synthetic stack frames of the label value at the root of the profile stack.
pprof's flamegraphs visualise these new stack frames, letting you see which HTTP routes and user IDs are causing the most usage.
The first specified label (here: http_route) inserts new frames at the new root stack frame with the values matching that key.
pprof -tagroot will land in go tool pprof with Go 1.18, expected Feb 2022. To use it today, install upstream pprof:
$ go install github.com/google/pprof@latest
Background
pprof is a software profiler data format & analysis toolkit, which ships with the Go programming language, but is also widely used also analyse profiles of many other languages.
Example: Profiling Hugo Static Site Generator
Previously, in Attributing Latency in Go with pprof Tags, I investigated why the Hugo static site generator was slow to build my site, using custom pprof Labels to drill-down by template name, generated page name, and the site section.
Hugo compiles each page of the site, and some pages are slow. It's hard to tell just from the stack trace what part of the site is being built, so I added custom pprof Labels to each page's generation, with:
labels := pprof.Labels(
    "target_filename", targetPath,
    "section", p.Section(),
    "template", t)

pprof.Do(ctx, labels, func(ctx context.Context) {
    [... compile the page ...]
})
Record a profile of building the website to hugo-slow.pprof:
$ cd graphviz.gitlab.io/
$ hugo --profile-cpu hugo-slow.pprof
Then open the profile in the browser:
$ go tool pprof -http :8080 hugo-slow.pprofThen click 'View', 'Flame Graph'.
This Flamegraph below (open fullscreen) only shows stack traces about texttemplate processing, with no information about which file/template is being processed.
Only showing code stack traces, without showing the input files the code is acting on, makes it hard to relate the profile to the input HTML templates, which are what I can control to make the site faster.
We can add information about which page is being compiled into the Flamegraph by generating new synthetic stack frames from the custom Labels, breaking down by site section, then template name, then target_filename:
$ pprof -http :8080 \
  -tagroot section,template,target_filename \
  -filefunctions \
  hugo-slow.pprof
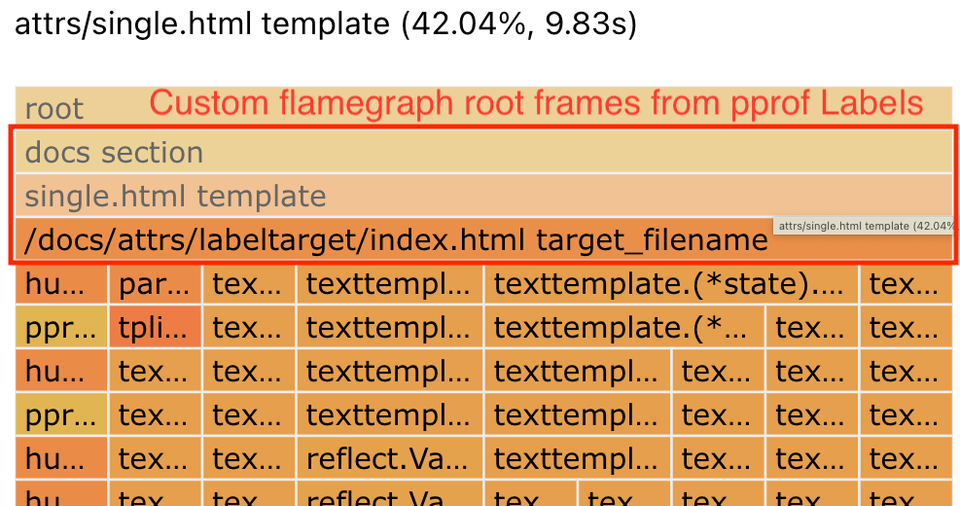
Gives this Flamegraph (open fullscreen):
Label keys are encoded as filenames of the generated stack frames. So we can show the label keys in the flamegraph using -filefunctions.
This flamegraph shows:
- On middle left hand side, second row: 64% of time spent in the
docssection - A small 3% of time spent in the
Gallerysection (far left) - Each section is broken down by which template used (e.g. middle, row 3: 42% in
attrs/single.html) - The right-hand side of the graph is the parts of Hugo that aren't directly generating an individual page, and they show
<unknown>for their synthetic label stack frames. This keeps the actual code stack frames all at the same level.
And you can click the new stack frames to drill down to identify where time was spent compiling individual sections, templates, and individual pages.
More Use Cases
You could break down your profile by:
- HTTP route: e.g.
/api/v2/profile. - UserID / Tenant ID, e.g. on a multitenant system where you suspect one user may be hogging all the resources.
- Process ID / Process Name. When looking at a whole-OS profile.
- Thread ID / Thread Name / Threadpool name. I use
-tagroot threadpoola lot when analysing multithreaded Android applications, to zoom in to the important threads: UI thread and RenderThread, and to discount work happening on a low-priority background thread. - Data Center / Availability Zone / Replica ID, if you are combining profiles together from many processes.
- You could break down memory profiles by the allocation size label.
- Types of input the code is acting on
Just be careful, your profiles will get very large if you add high-cardinality labels.
With combinations of the above, you could e.g. drill down an entire globally replicated cloud server with:
pprof -tagroot datacenter,job,replica,process_name,threadpool,thread_name,http_routeYou can also pivot by selecting labels in a different order. You could analyse the above in any order, for example, -tagroot http_route,threadpool to see a global profile broken down by HTTP route & threadpool.
Also new: pprof -tagleaf
For symmetry, we also added -tagleaf, which is the same as -tagroot, except it inserts new stack frames for the labels at the stack leaves instead of the stack root.
If you specify multiple labels -tagleaf http_route,user_id then the last item user_id becomes the new leaf stack frame, with http_route immediately before.
While tagroot is useful for going from a label to the stacks inside it, tagleaf is useful if you want to drill down from code to the label. Perhaps you have a hotspot, and you aren't sure which thread is causing the hotspot. -tagleaf thread lets you drill down from from the code to the thread responsible.
More pprof Label Resources
- JBD's original Profiler labels in Go
- My previous post: Attributing Latency in Go with Pprof Tags
- JetBrains' GoLand IDE Profiler supports pprof Labels (and their Debugger)
- PolarSignals' Demystifying Pprof Labels with Go (example code)
- Code example: OpenCensus adds pprof Labels
- Code example: felixge's example
- I added
pid,tid,thread,threadpoolpprof labels to Android CPU profiles.
Credits
Thanks to:
- Felix Geisendörfer, who first implemented this technique publicly with
pprofutil labelframes. - Maggie Nolan for design help, and for filing a feature request issue that was so clear an outsider like myself could implement it.
- Alexey Alexandrov, for a very patient code review that made the end result much better.


Comments ()