Visualising Sydney/NSW Rents
NSW Government Fair Trading holds bonds for all residential tenancies in NSW, and every month they publish Excel spreadsheets of weekly rent, broken down by postcode, bedrooms, property type (house/flat/townhouse), and lodgement date. The data is licensed under Creative Commons Attribution.
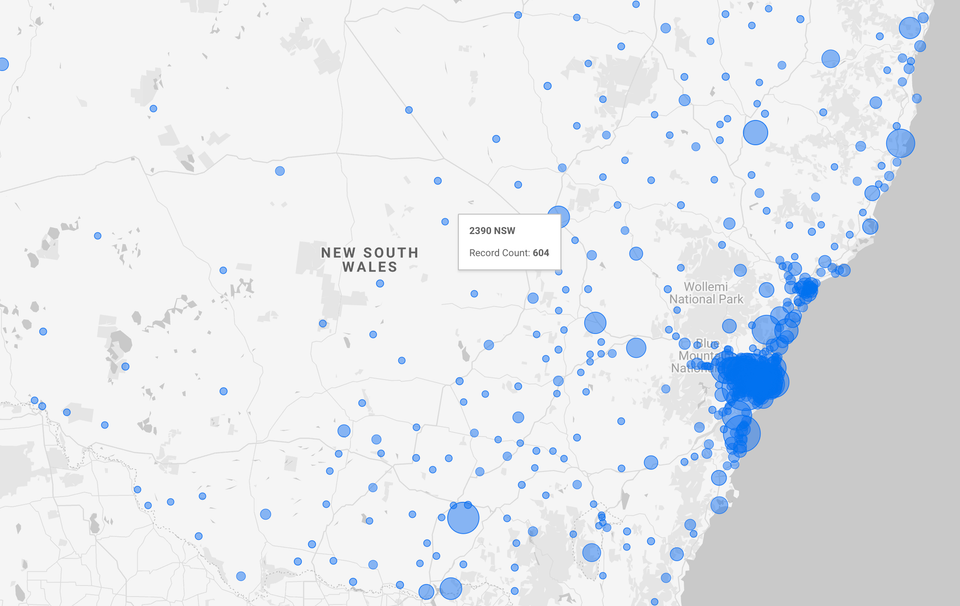
I converted and imported this data into Google Data Studio to visualise NSW rental bond lodgements. I've embedded the report below, but it's best opened fullscreen.
Click on the map to drill-down by postcode, and use the top filters to narrow down by bedroom, property type, postcode, and change the timeline. You can share links to any filtered views over the data you create.
I'm pretty happy with how the CDF turned out, laying out all the rents on a single chart, letting you see all percentiles of the rents, not just the median or mean like domain/realestate.com.au offer. The summary statistics (median/mean) often hide significant changes at the upper and lower percentiles.
I particularly appreciate the monthly release frequency (not yearly). This frequency enables seeing short-term trends like how COVID-19 is affecting rents in your postcode.
I've open-sourced the code combining the 20+ Excel Spreadsheets into a single table.
This post was heavily inspired by Jeff's post visualising Boston rents.


Comments ()