Colouring Firefox Profiler Flamegraphs
This post covers: Adding colours to Firefox Profiler, and some neat tricks I learned along the way: data-oriented-programming in JavaScript, data format upgrade pipelines, and developer experience in test runners and console UI.
As I mentioned in Linux perf Profiler UIs, I quite like Firefox Profiler for analysing Linux perf traces. It's very responsive, cross-platform, linkable, searchable, and filterable by threads and timespans. And despite the name, you can use it in any browser. It's great software.
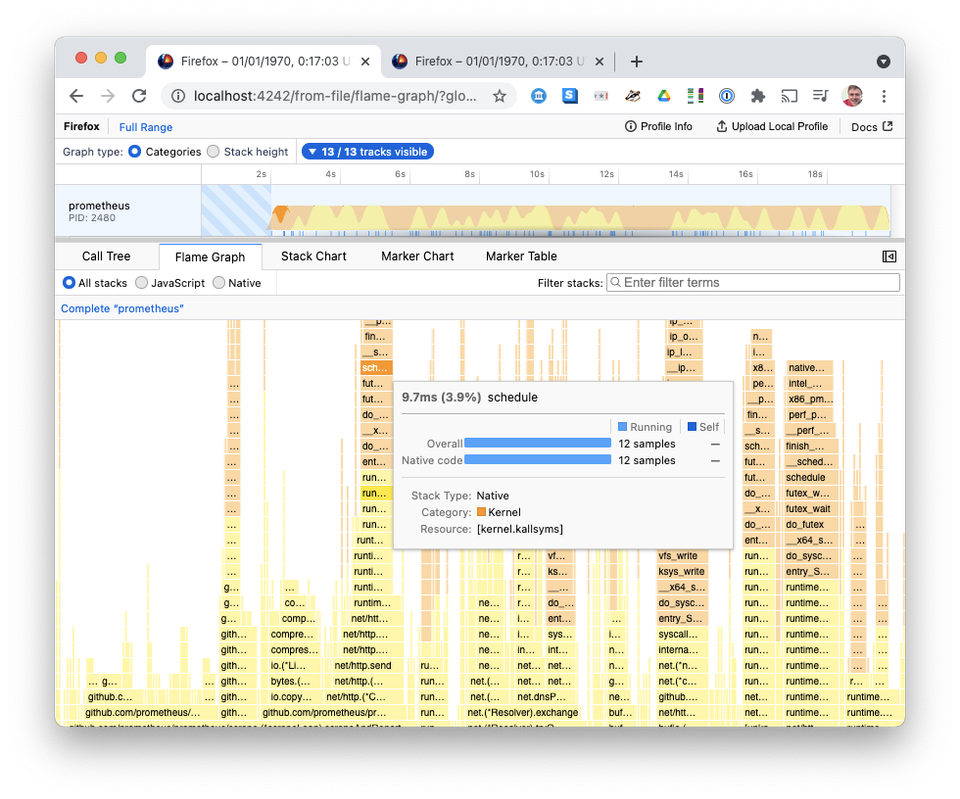
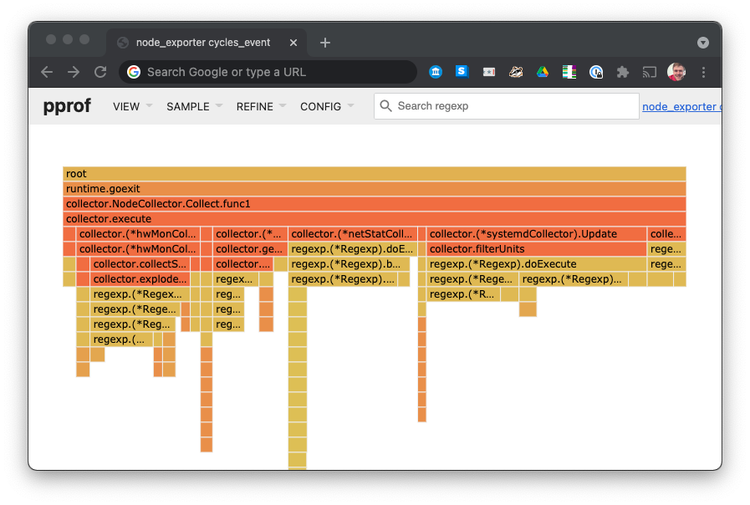
I'm encouraging my colleagues to use it to debug Android performance problems. My only hesitation is, the default output is, well, a bit grey:
Other Flamegraph implementations can color stacks by the language used, the library used, and user vs kernel code. As a first step, I've submitted a pull request colouring kernel frames differently from user-land code:
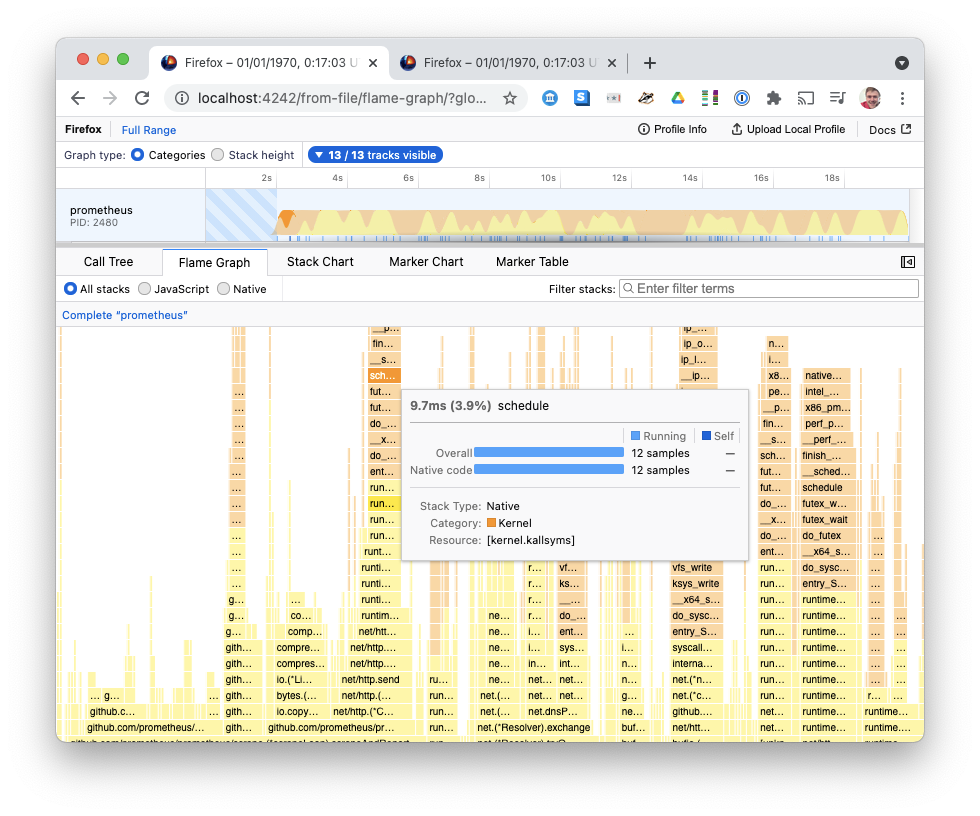
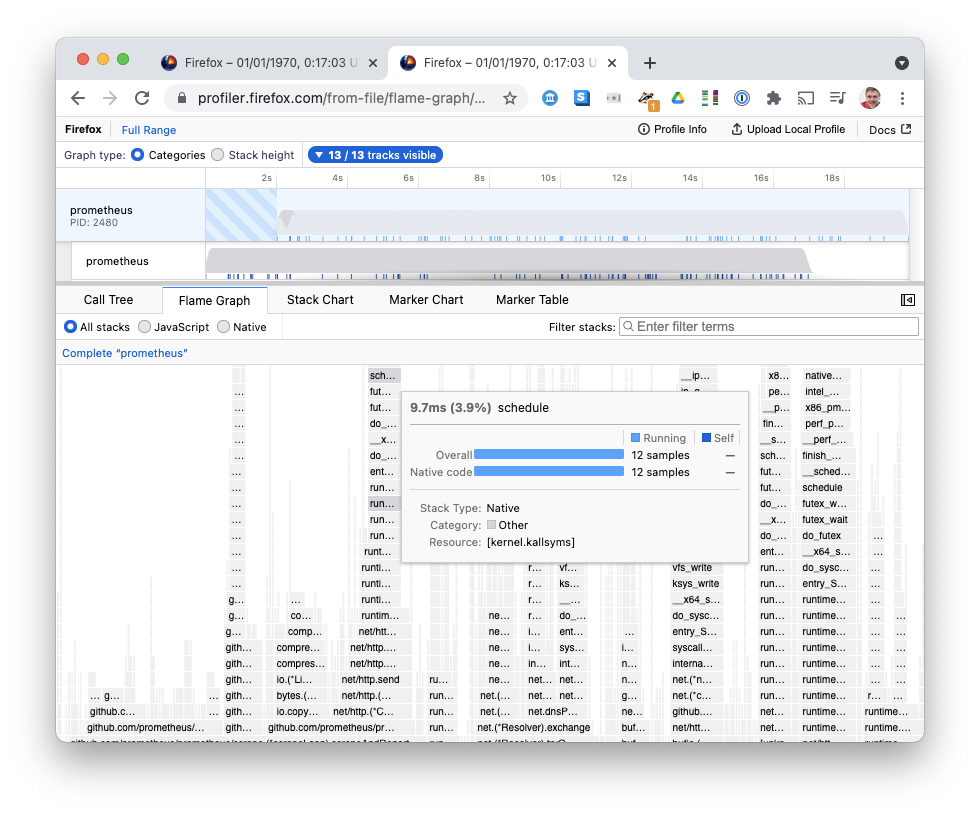
This lets us quickly disambiguate yellow User code (typically compute) from orange Kernel code (typically Input/Output).
Firefox Profiler let me define my own custom categories, so I defined User and Kernel, and selected the stack frame category depending on whether frame.contains('kallsyms'), which seems to be a reasonable heuristic for identifying Linux Kernel code.
Hacking on Firefox Profiler
It was fairly easy! The docs were good for how to get the development environment up and running. The edit-compile-debug cycle was fairly fast: reloading your browser is great. The team were responsive in a public chatroom when I asked for some guidance.
Overall, if you want a profiler UI for some new language or OS, I think the Firefox Profiler is a flexible base, and making an importer is fairly easy.
While reading the Firefox Profiler sources, I learned some interesting techniques, worth calling out, which I might be able to apply to other projects:
Data-Oriented Programming in JavaScript
I'd just finished reading about Data Oriented Design, and I didn't really have the imagination to see how you would do data-oriented-programming in JavaScript. So I was excited to see a JavaScript example in the wild here.
Firefox Profiler uses two data formats:
Row-oriented Array-of-Arrays, of the form {schema:{}, data:[]}. e.g. the Linux Perf importer's "Frame Table" is defined as:
    const frameTable = {
      schema: {
        location: 0,
        implementation: 1,
        optimizations: 2,
        line: 3,
        category: 4,
      },
      data: [],
    };
Then built up by pushing to data:
frameTable.data.push([locationIndex, implementation, optimizations, line, category]);You end up with a row-oriented array-of-arrays data, where the inner arrays are indexed by the schema.
This is convenient for building up a table. Then Firefox Profiler converts this to column-oriented Struct-of-Arrays format. For frameTable above, this is converted to:
{
  location: [...],
  implementations: [...],
  optimizations: [...],
  line: [...],
  category: [...]
}
The comment notes why this should improve performance:
This isn't very nice to read, but it drastically reduces the number of JS objects the JS engine has to deal with, resulting in fewer GC pauses and hopefully better performance.
This also probably saves a lot of object headers, and improves cache locality too, for if you only read a subset of columns, this lets the CPU cache and memory bus avoid reading in unused data.
I'm not sure if this would enable the compiler to generate SIMD instructions (I'd guess the JavaScript engine probably isn't smart enough to use them?), but it certainly makes SIMD more possible than in the array-of-arrays representation.
There are probably further optimisations we could do here: for example, there are a lot of integers that might be stored as double-precision floating point numbers. Uint32Array could help. A few of these arrays are boolean arrays, which could be potentially converted to bit sets, or sets of IDs, to save memory.
Profile Upgrade Pipelines
The Firefox Profiler visualises profiles from old versions of Firefox, not just new versions. But they don't want to have to fork the code to handle every old version.
Instead, they built a pipeline that recursively upgrades old profile schemas to the new schema.
I came across this code because the Firefox linux-perf importer outputted an old schema version, but I wanted to use some new schema features, so I had to upgrade the schema output.
I think the upgrade code is really quite a clever pattern, I've extracted and paraphrased it below:
// _upgraders[i] converts from version i - 1 to version i.
// Every "upgrader" takes the profile as its single argument and mutates it.
/* eslint-disable no-useless-computed-key */
const _upgraders = {
  [1]: () => {
    throw new Error(
      'Gecko profiles without version numbers are very old and no conversion code has been written for that version of the profile format.'
    );
  },
  ...
  [4]: profile => {
    // In version < 3, p.libs was a JSON string.
    // Starting with version 4, libs is an actual array, each lib has
    // "debugName", "debugPath", "breakpadId" and "path" fields, and the
    // array is sorted by start address.
    convertToVersionFourRecursive(profile);
  },
  [5]: profile => {
    // In version 4, profiles from other processes were embedded as JSON
    // strings in the threads array. Version 5 breaks those out into a
    // separate "processes" array and no longer stringifies them.
   convertToVersionFiveRecursive(profile);
  },
  ...
};
This is clearly working well for them: they are able to upgrade from version 4 all the way to 24, one step at a time. I'd seen database migration patterns for SQLite databases in Android before, but never a pipeline quite this long.
In-Developer-Console Documentation
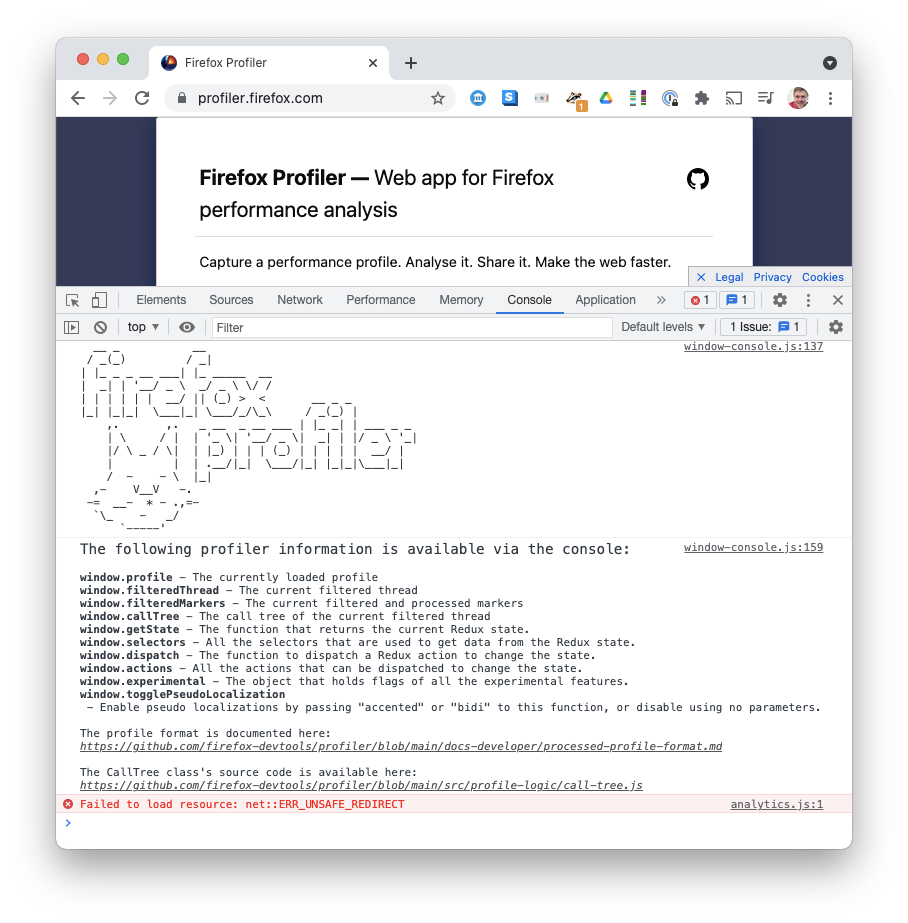
Pop open the Developer Tools Console on Firefox Profiler, and you see this friendly cat walking you through how to inspect important variables from the console:
There are a few smart things here:
- The cat makes me laugh; makes it seem friendlier. It seems silly but this page has a big difference in feel from just a list of variables!
- The important variables are explicitly added to the
windowobject for debugging. This is a deliberate choice – most frameworks will mangle your variable names to make it shorter, and hide your variables inside a closure so that extensions can't overwrite them. - The important variables are documented in the place that you use them!
- They use bold, italic, different fonts, and even hyperlinks. I didn't know this was possible in the console UI.
I wish that Android development had something similar to the web console. the Android Studio debugger is just not the same.
Jest Test Runner
I have been out of the JS world for a while, and I hadn't seen Facebook's Jest test runner. Jest runs Firefox Profiler's tests, and has some neat tricks worth sharing:
- Jest reorders the test run so that tests that failed last time are first in line to be rerun. If you have more tests than available parallelism, this shortens your edit/test cycle substantially.
- Jest remembers how long tests took to run last time, and shows a progress bar while the tests are rerunning. Of course, this isn't perfectly accurate, particularly when other apps are using the CPU. But I found it useful, even accounting for the inaccuracy.
 PASS  src/test/components/Timeline.test.js (8.064 s)
 RUNS  src/test/store/publish.test.js
 RUNS  src/test/components/Timeline.test.js

Test Suites: 0 of 106 total
Tests:       27 passed, 27 total
Snapshots:   0 total
Time: 9 s, estimated 101 s- Jest has a file watcher with a curses console UI that lets you press a single key to update failing golden tests in your repository, and rerun the test. That helped me when I was working on the upgrade pipeline, which used a few golden files.
Watch Usage
 › Press a to run all tests.
 › Press f to run only failed tests.
 › Press p to filter by a filename regex pattern.
 › Press t to filter by a test name regex pattern.
 › Press q to quit watch mode.
› Press Enter to trigger a test run.- For every test, Jest tells you how long it ran, in the console. I think this might provide good incentives to make slow tests faster; if your colleagues all see your test is the slowest, they might ask you to fix it :-)
Jest has a lot of good ideas that other test runners should steal!
Future Work
Would be great to have more colour schemes for more profiles of more languages. I'm not sure how we'd allow users to specify the language – perhaps in the UI, or perhaps in a header of the file?


Comments ()