Linux perf Profiler UIs
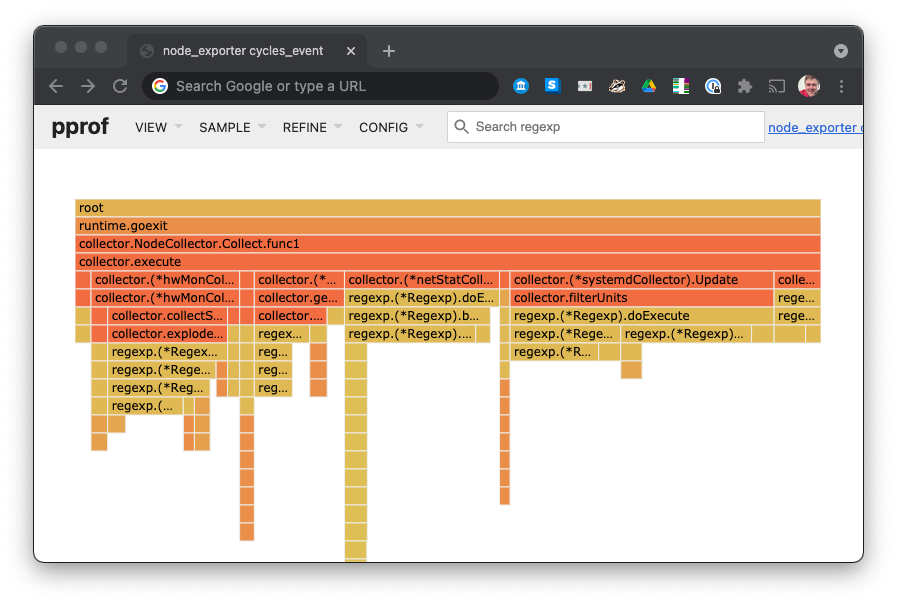
pprof Web UI looking at a flamechart of regexp stack traces.This post is a quick literature review of CPU profiler user interfaces available for analysing Linux program performance.
I couldn't find any list of profiler UIs online. Hopefully this can help people find the profiler UI that's right for them.
CPU Profiler output is extremely multidimensional — processes, threads, stacks, frames, libraries, kernels, so making sense of it requires strong visualisation tools. A profiler that's a good fit for the work you're doing can save you a lot of time, so it's worth evaluating the options.
I’ll be focussing on profilers that can visualise the output of the linux perf tool (aka linux-perf-tool aka perf_events, because that’s what I’m profiling with right now.
perf can interrupt threads to record thread's stack traces, triggered by an event (e.g. a thread context switch, or a syscall) or on a regular schedule (e.g. 4000 times a second), e.g.:
# Prerequisite: install debug symbols.
$ sudo apt install gzip-dbgsym

# Record stack traces of gzip at 4000Hz
# --call-graph dwarf is required because gzip for Ubuntu was built with -fomit-frame-pointer
$ perf record -g --call-graph dwarf -F 4000 -o perf.data gzip -9 somebigfile.txt

# Record stack traces of gzip every time it context switches
$ perf record -g --call-graph dwarf -e context-switches -o perf.data gzip somebigfile.txt
perf outputs a binary perf.data file containing all the samples, which can be formatted as text by the perf script subcommand:
$ perf script
[...]
gzip 83220 36556.175587:     241937 cycles:
            55c83b5a2773 longest_match+0x103 (/usr/bin/gzip)
            55c83b5a3010 deflate+0x470 (/usr/bin/gzip)
            55c83b5abae3 zip+0x1d3 (/usr/bin/gzip)
            55c83b5a53cb treat_file+0x54b (inlined)
            55c83b5a1feb main+0x65b (/usr/bin/gzip)
            7f4547c5f0b2 __libc_start_main+0xf2 (/usr/lib/x86_64-linux-gnu/libc-2.31.so)
            55c83b5a21bd _start+0x2d (/usr/bin/gzip)

gzip 83220 36556.175801:     247911 cycles:
            7f4547cf6e8e __memcpy_sse2_unaligned_erms+0x16e (inlined)
            55c83b5a2997 memcpy+0x87 (inlined)
            55c83b5a2997 fill_window+0x87 (/usr/bin/gzip)
            55c83b5a2d34 deflate+0x194 (/usr/bin/gzip)
            55c83b5abae3 zip+0x1d3 (/usr/bin/gzip)
            55c83b5a53cb treat_file+0x54b (inlined)
            55c83b5a1feb main+0x65b (/usr/bin/gzip)
            7f4547c5f0b2 __libc_start_main+0xf2 (/usr/lib/x86_64-linux-gnu/libc-2.31.so)
            55c83b5a21bd _start+0x2d (/usr/bin/gzip)
perf script: raw per-sample stack traces with program name, pid, timestamp, and cycle count, program counter, symbol, and binary.Perf-Report

The perf report subcommand is bundled with the perf tool. Has curses and text output, is rather limited visualisation support. Decent for scripting. Lets you slice the data by pid (process ID), tid (thread ID), and library name (e.g. libc.so), and show most common stack traces. Low level, powerful, limited visualisation. Has a GTK interface, which I haven’t tried.
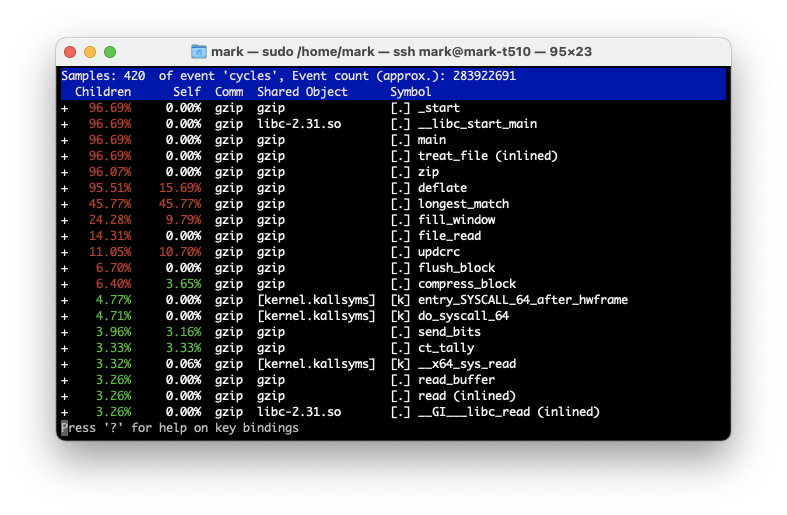
perf report curses interface analysing a gzip profile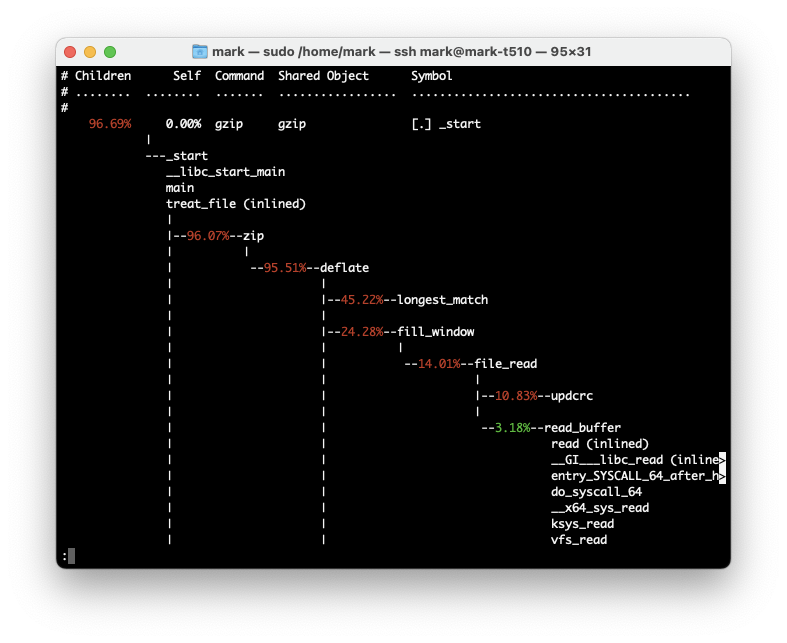
perf report --stdio interface, analysing a gzip profileFirefox Profiler
 firefox-devtools
This is a client-side web app, which can read the output of perf script files if you drag and drop them in.
$ perf script -F +pid > /tmp/test.perf
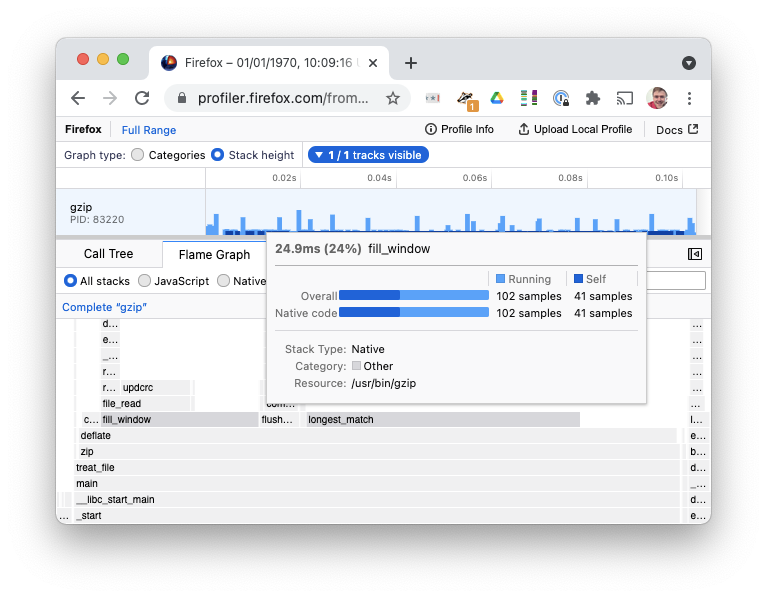
gzip. Open in Firefox ProfilerFirefox Profiler has a powerful per-thread timeline, filtering by timeline+thread(s), Flame Chart, chronological Stack Chart, & stack-frame search.
My favorite feature: "Upload local profile" gives you a shareable link, which you can send to colleagues pointing them at exactly where their code is slow ;-)
Speedscope
jlfwongAnother web page where you drag and drop your profile in.
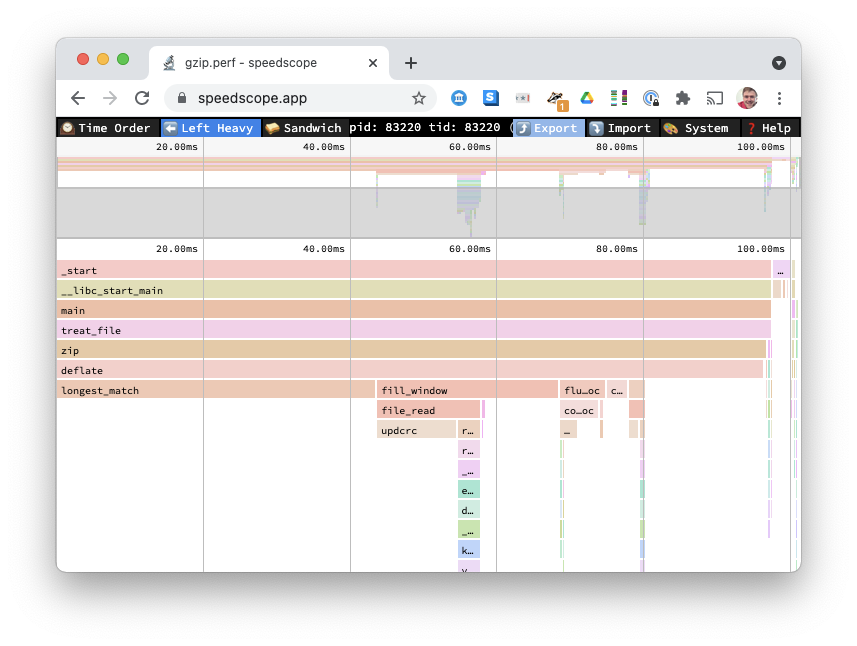
A little unpolished (the fuzzy stackframe search is counterproductive), I would usually use the Firefox Profiler over this. Supports chronological and flamegraph views, but does not support filtering a timeline to see a flamechart of that duration.
FlameGraph
brendangreggSlots nicely into a unix pipeline, with grep/sed to filter and rewrite stack frames. Many profiles need a bit of 'preprocessing' before they are renderable.
Can render the output of perf script:
$ perf script | ./stackcollapse-perf.pl | ./flamegraph.pl > flame.html
You can use ./flamechart.pl --flamechart to get a chronological stack view.
Limited chronological filtering & multithread visualisation, do the filtering in your pipeline instead.
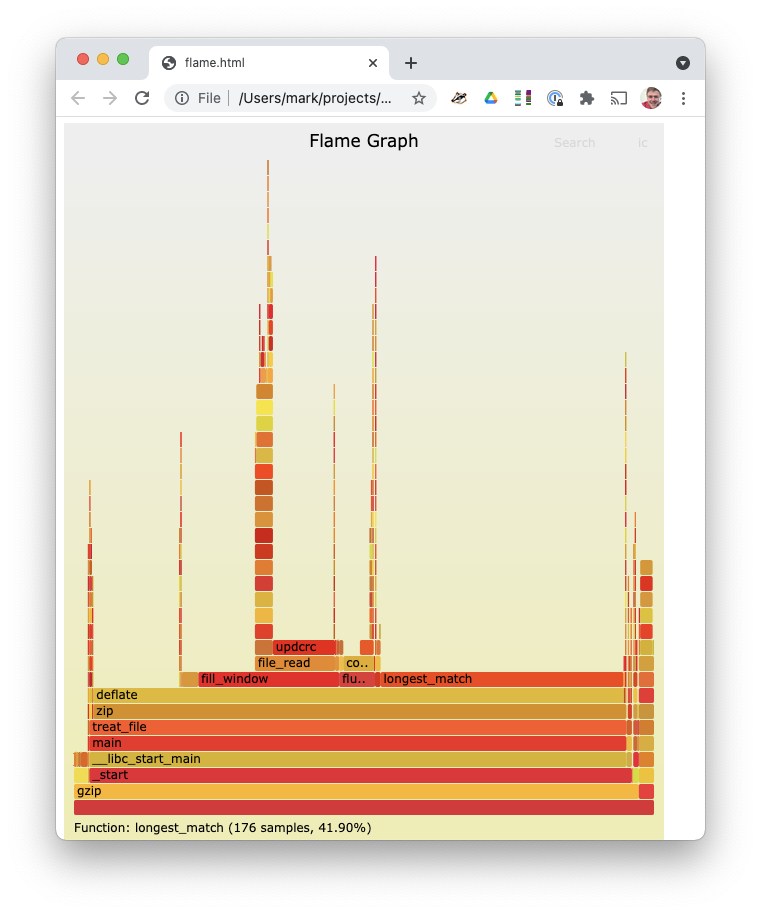
flamegraph.pl output for a gzip profileThe FlameGraph library is generally far more flexible than other alternatives, as the original flame visualisation implementation, it has grown a large set of language-specific colour themes and profile input formats.
Inferno-Flamegraph / FlameGraph-rs
jonhooJon Gjengset's Inferno is a Rust port of the FlameGraph libraries, improving their performance.
This library is used by FlameGraph-rs, which offers a single command for running a binary and generating a flamegraph:
flamegraph-rsThe output images look the same as the Perl FlameGraph library.
Notable, inferno supports diffing flamegraphs.
FlameScope
NetflixNetflix's FlameScope renders perf data on a 2D grid (seconds along x axis and milliseconds on y axis), as a space-filling histogram. Useful for visualising a long timeline and zooming in on problem timeslices. Perhaps you might use this for profiling a busy server, or a post-startup 'stead state' session in a client app.
For this demo, we will use a longer window, over the entire system -a for 60 seconds:
$ perf record -g -F 1000 -a -- sleep 60
$ perf report > profile.txt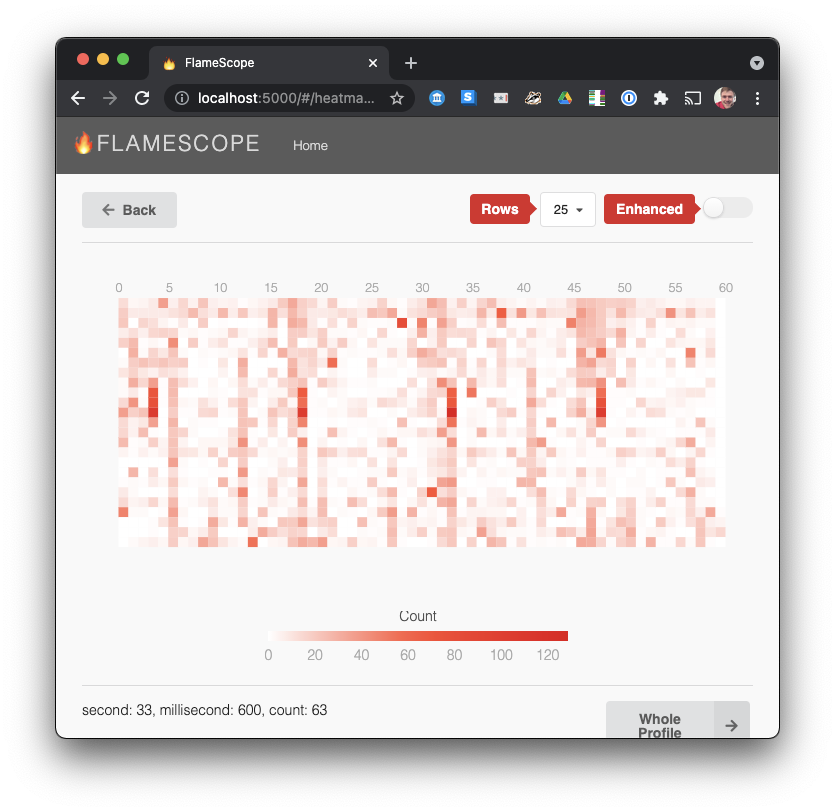
In this, we see a regular spurt of CPU activity for about 20% of a vertical line (1/5 of a second), every 15 seconds (not surprising, as this is a server running Prometheus, monitoring some servers every 15 seconds).
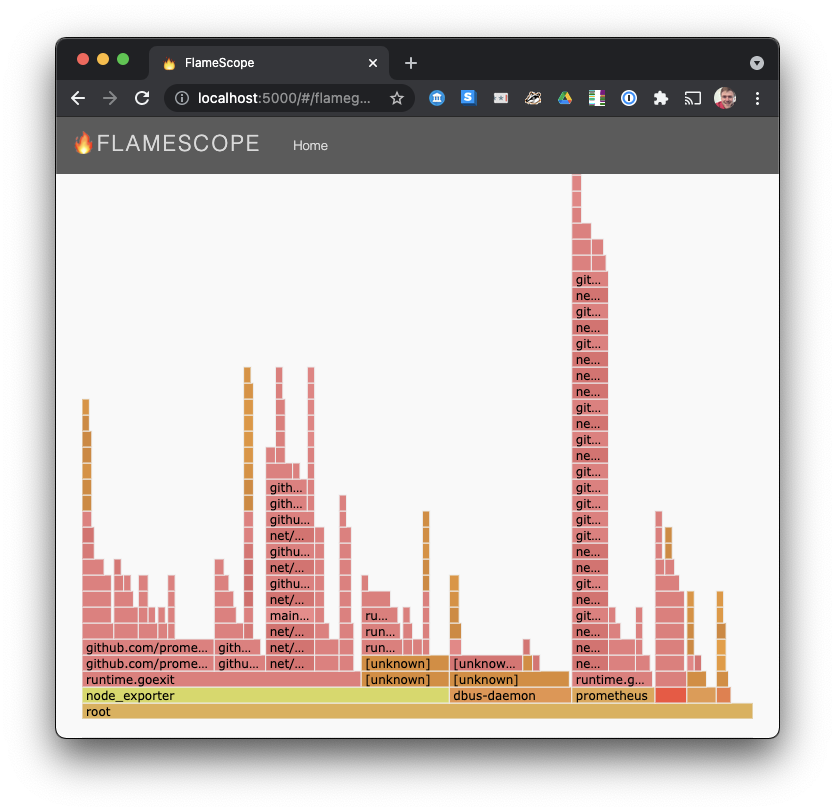
Aside: this style of 2D visualisation of a large time unit along the x-axis and a smaller time unit along the y-axis reminds me of my earlier Scatter.FM project visualising songs you listen to.
We can select start/end times on the dark lines to see a flamechart filtered to that exact duration, and we see indeed that it's prometheus and node_exporter using the CPU:
pprof
googlepprof is a very mature profiler, used by Google since 1998. Has an interactive command-line for filtering and displaying top traces, flamegraphs, a web ui, and Graphviz visualisation of expensive code paths.
pprof is a powerful aggregated profile analysis toolkit, but note that pprof is an aggregated format that dedupes similar stacktraces, so you lose a chronological view, only supporting flamegraph-style visualisations.
perf_data_converter converts linux perf.data files to pprof format, and Go programs natively output pprof format for their profiles.
For the below examples, I'll profile a node_exporter server monitoring program, which collects stats about the server for exporting to the Prometheus timeseries database:
$ sudo perf record -p (pidof node_exporter) -g -F 4000
$ sudo chown mark perf.data
$ perf_to_profile -i perf.data -o node_exporter_pprof.profile
pprof: Interactive Command Line
The interactive command line is powerful, allowing you to inspect top stack frames. The (pprof) string is a command prompt, like a shell:
$ go tool pprof node_exporter_pprof.profile
File: node_exporter
perf-version:5.8.18
perf-command:/usr/lib/linux-hwe-5.8-tools-5.8.0-44/perf record -p 907 -g -F 4000
Type: cycles_event
Entering interactive mode (type "help" for commands, "o" for options)

(pprof) top
Showing nodes accounting for 455922966, 56.62% of 805225260 total
Dropped 561 nodes (cum <= 4026126)
Showing top 10 nodes out of 268
      flat  flat%   sum%        cum   cum%
 272586235 33.85% 33.85%  275124492 34.17%  [[kernel.kallsyms]]
  47768920  5.93% 39.78%   61999433  7.70%  runtime.scanobject
  46230494  5.74% 45.53%   94340123 11.72%  runtime.mallocgc
  23001588  2.86% 48.38%   24156731  3.00%  runtime.heapBitsSetType
  13425895  1.67% 50.05%   13425895  1.67%  runtime.memclrNoHeapPointers
  12917952  1.60% 51.65%   13808581  1.71%  runtime.findObject
  11461893  1.42% 53.08%   27733389  3.44%  compress/flate.(*compressor).deflate
  11313969  1.41% 54.48%   12692065  1.58%  regexp.(*Regexp).tryBacktrack
   8807645  1.09% 55.58%   11315463  1.41%  compress/flate.(*compressor).findMatch
   8408375  1.04% 56.62%    9304189  1.16%  runtime.ifaceeq
And filter to specific stack frames, e.g. regexp, which accounts for almost 3% of our total CPU cycles:
(pprof) focus=regexp
(pprof) top
Active filters:
   focus=regexp
Showing nodes accounting for 22491964, 2.79% of 805225260 total
Showing top 10 nodes out of 50
      flat  flat%   sum%        cum   cum%
  11313969  1.41%  1.41%   12692065  1.58%  regexp.(*Regexp).tryBacktrack
   4223279  0.52%  1.93%    4939183  0.61%  regexp.(*Regexp).doOnePass
   1323732  0.16%  2.09%    1323732  0.16%  regexp/syntax.(*Inst).MatchRunePos
   1166463  0.14%  2.24%    7241677   0.9%  regexp.(*Regexp).FindStringSubmatch
    847119  0.11%  2.34%     847119  0.11%  runtime.memclrNoHeapPointers
    770268 0.096%  2.44%     770268 0.096%  [[kernel.kallsyms]]
    760164 0.094%  2.53%    2193106  0.27%  runtime.mallocgc
    756370 0.094%  2.63%    1472274  0.18%  regexp.onePassNext
    744777 0.092%  2.72%     744777 0.092%  regexp.lazyFlag.match
    585823 0.073%  2.79%     585823 0.073%  runtime.heapBitsSetType
There are plenty more filter options
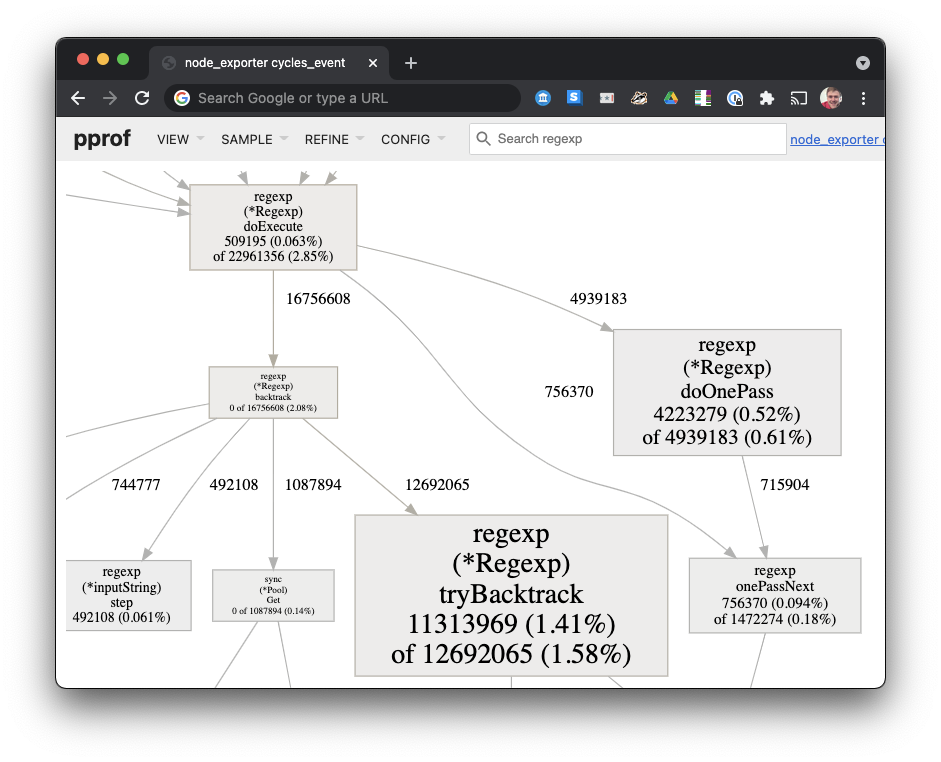
pprof: Graphviz UI
pprof can use Graphviz to render directed graphs of the callstacks, showing more frequent stack frames in bigger font.
This one was rendered searching for stacks containing regexp using:
$ go tool pprof --focus regexp --http localhost:8090 node_exporter_pprof.profileThe output graph is huge, so I've just zoomed to an interesting bit here, where we see that tryBacktrack is a huge node, representing more CPU cycles than the other nodes in the frame. Edges represent function calls:
pprof: FlameChart UI
The web server shipping with pprof can render flamegraphs:
$ go tool pprof --http localhost:8090 node_exporter_pprof.profileThen navigate to http://localhost:8090:
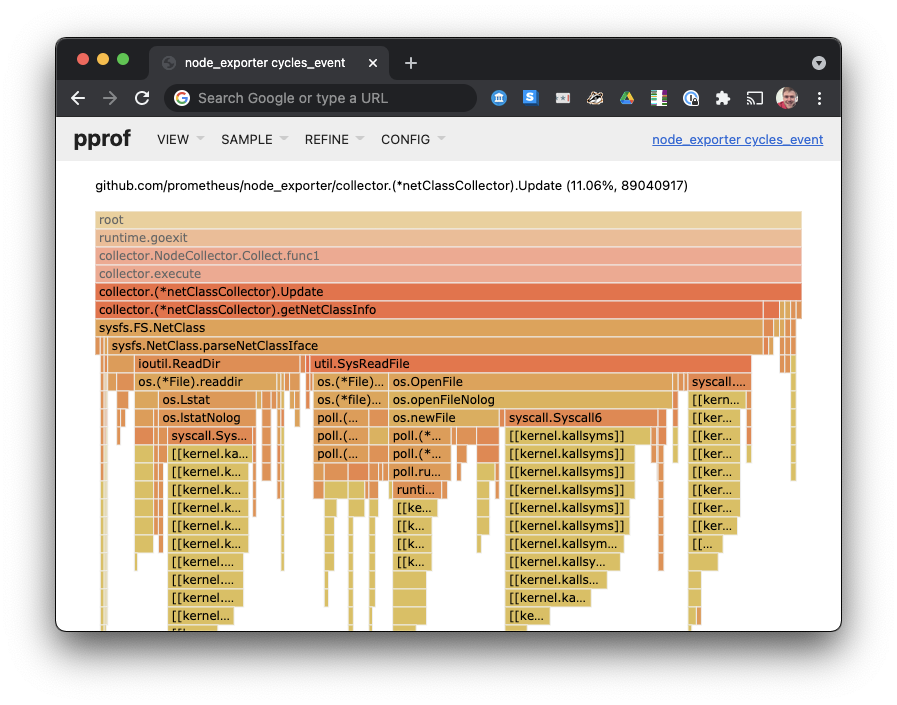
node_exporter zoomed in to Update, which reads from files. I don't have debug symbols for my kernel available here.pprof: Disassembly UI
This is a rare feature: pprof can show you time spent in each assembly instruction:
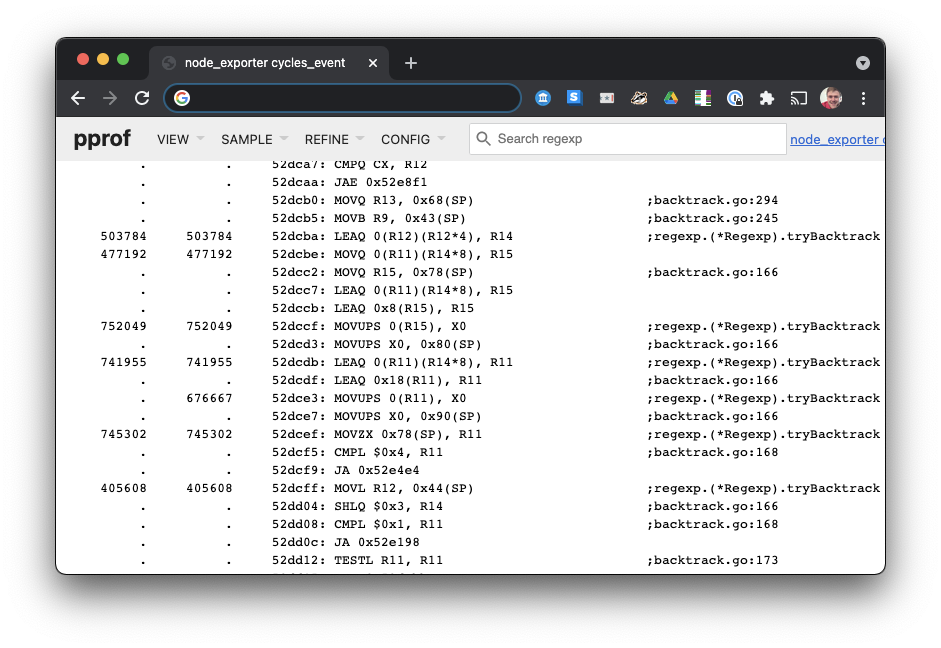
This is fairly advanced stuff that I haven't used much yet. I mostly write Java code, which doesn't have easy disassembly Go code does here.
Google Cloud Profiler

Google Cloud Profiler visualises pprof-format data in a Flamechart in the browser, with drilldown and link sharing. If you run code on GCP, this is a good option.
Here's a pprof of compiling the Hugo source of the Graphviz docs:
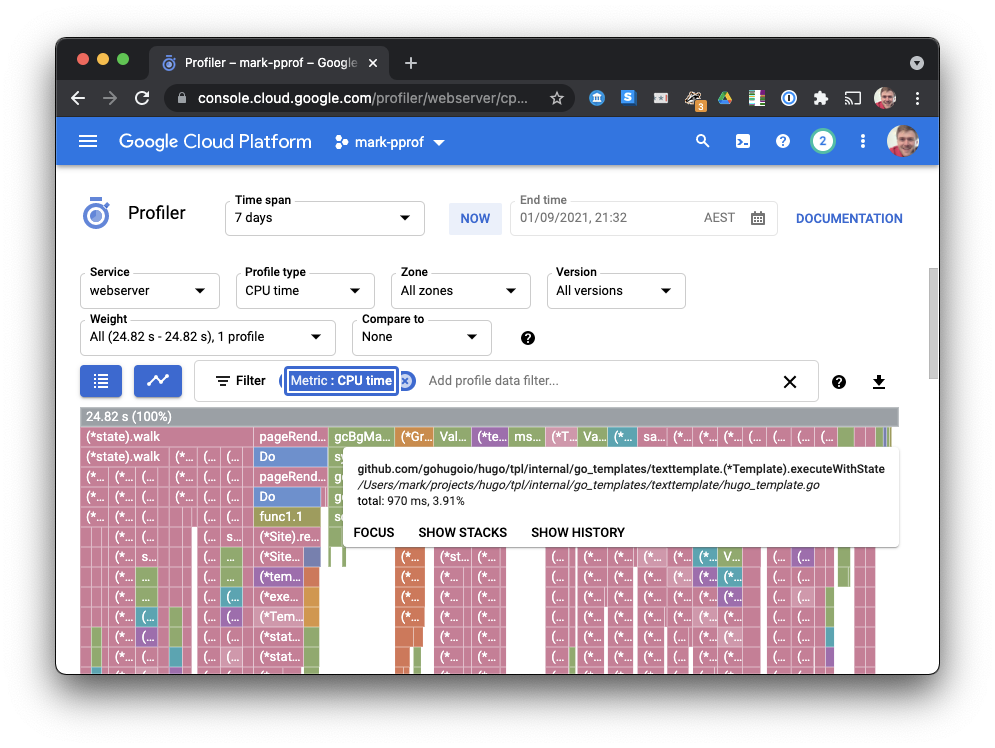
Google Cloud Profiler mostly geared towards profiling running cloud processes, but you can upload profiles from your workstation using https://github.com/rakyll/pprof-upload:
$ pprof-upload -i pprof.profile -target=webserver -project=mark-pprofAndroid Studio CPU Profiler
Android Studio can read a protobuf format. I'm not aware of a converter for desktop linux, but you can import Android perf profiles using these instructions.
Perfetto
An amazing tracer, I use it all the time for Android and Chrome tracing. But doesn’t yet support reading perf.data files
perf timechart
The perf tool ships with a built-in SVG timechart generator. Let's try it, with a workload that has a good mix of disk IO and computation: computing the disk space used in /home with du -sh /home/:
$ sudo perf timechart record du -sh /home
2.5G	.
[ perf record: Woken up 7 times to write data ]
[ perf record: Captured and wrote 2.792 MB perf.data (19618 samples) ]

# Filter to only the du programm in the trace, and make the image narrower for the blog
$ sudo perf timechart --process du --width 600
Written 0.5 seconds of trace to output.svg.
Opening output.svg, we see a track for the du (Disk Usage) program, and tracks per-CPU showing all programs running on those CPUs, color-coded (blue is running, red is blocked or idle):
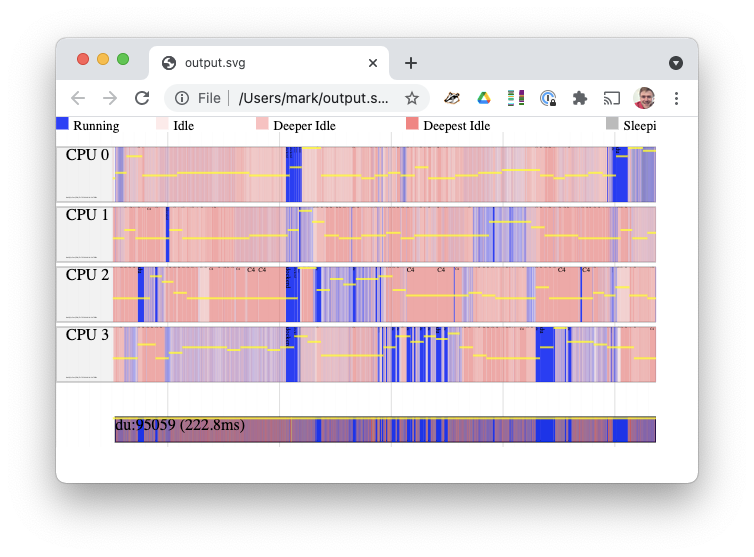
perf timechart output for du -shBeware, this was a 3MB SVG file for 200ms of tracing, and it's far larger if you show all processes (if you skip --process du). Some people report unusable 500MB SVG files from 5 seconds of tracing. Even loading my smaller profile locked up the browser for a few seconds.
Profiler UIs I haven't tried yet
I include these for completeness, in case they're useful.
KDAB Hotspot
KDABNo, not the HotSpot JVM. A Qt window for profiling. Shows flamegraphs, bottom up, topdown hierarchies, and per thread timelines.
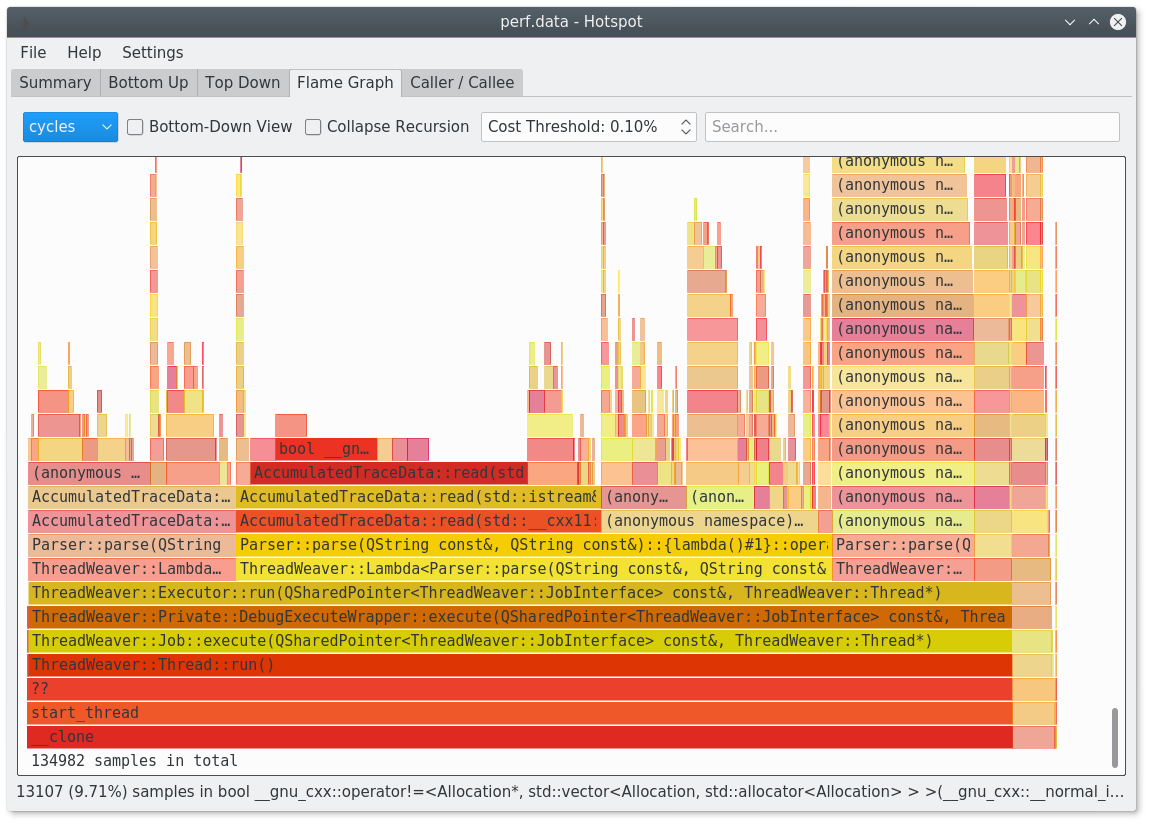
hotspot from their GitHubSadly is Linux-only, and has no browser UI, so is harder to link results with colleagues. I haven't tried it.
CacheGrind
 llunak
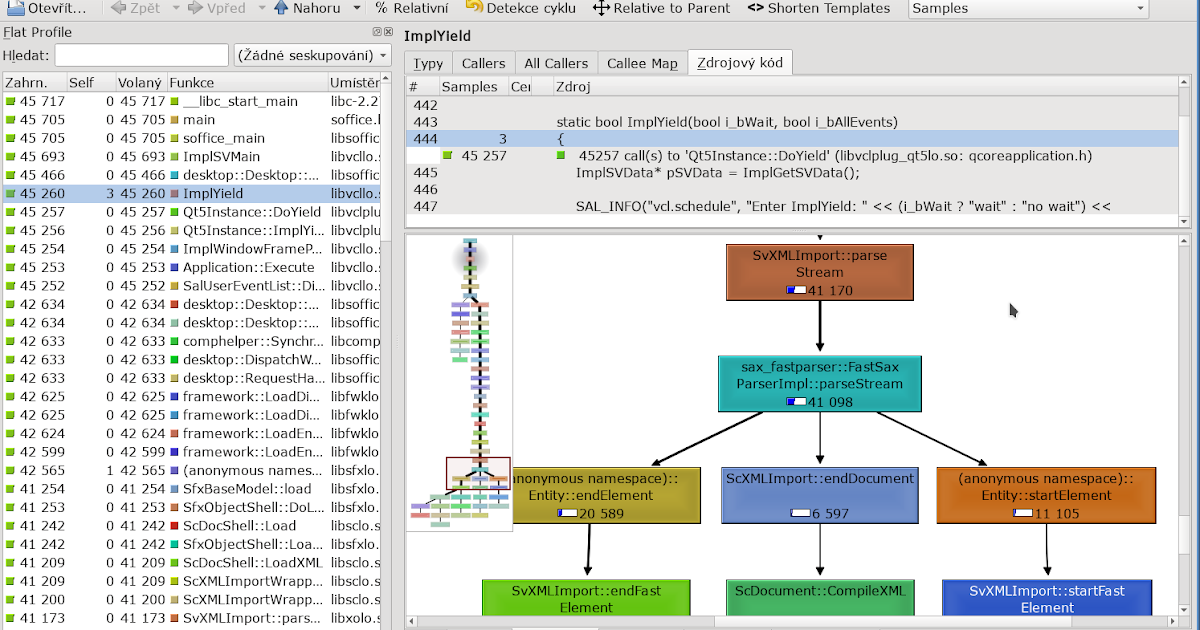
KCacheGrind/QCacheGrind are visualisers originally built for Valgrind, and people have made converters from perf.data format. I haven’t tried them.
Install on macOS with brew install qcachegrind.
Purgatorio

Purgatorio is a chronological trace viewer distributed with the Android Platform.
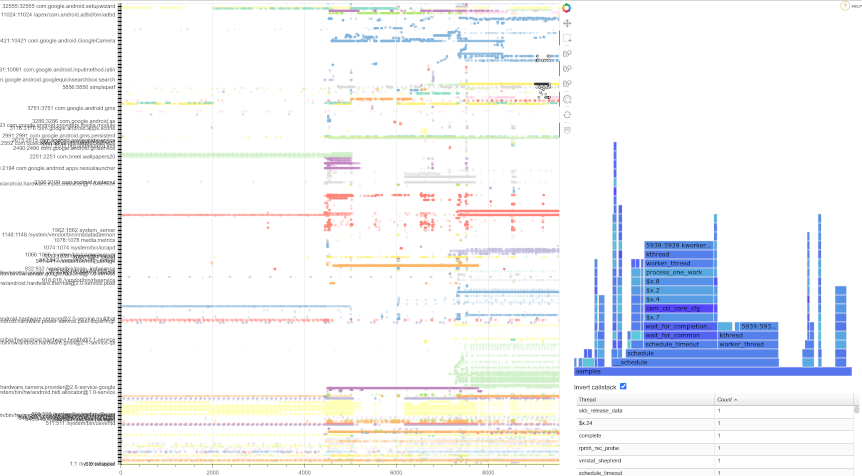
I haven't tried it, and I include it for completeness.
Others
- http://profilingviewer.com/ – Callgrind viewer for macOS.
- http://mcg-app.com/ – MCG lets you analyse your application profile data natively on your Mac.
- https://github.com/jokkedk/webgrind – PHP Xdebug profiling web frontend.
- https://github.com/jrfonseca/gprof2dot – Converts the output from many profilers (including perf script) to Graphviz.
- https://github.com/torvalds/linux/tree/master/tools/perf/scripts – Perl and Python scripts for massinging
perfoutput. - https://github.com/cunctator/traceshark – Qt GUI viewer for ftrace and perf events. See discussion on
linux-perf-users. Use it on a Linux box; I had trouble compiling it for macOS. - KCacheGrind / QCacheGrind (really the same software).
- Qt Creator Profiler
- Chrome DevTools JavaScript Profiler, if you convert the profile with cpuprofilify.
- Sysprof: a GNOME profiler UI.
Conclusion
I recommend Firefox Profiler the most, with its very responsive UI, great searching, multi-thread view, and filtering by timeline duration.
I enjoy FlameScope for visualising very long profiles; other visualisations struggle to show patterns in long-running profiles.
Did I miss any? Let me know. Discuss on Twitter or drop comment below.
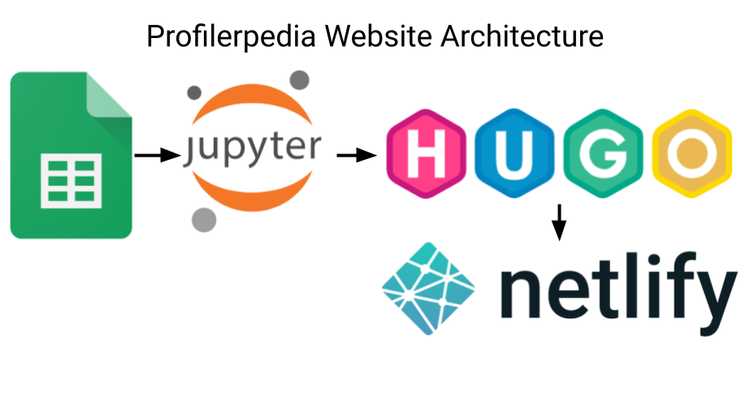
Next in this series: I expand this research to all profilers, not just Linux profilers, with Profilerpedia.


Comments ()