Reverse Engineering Graphviz's Architecture by Profiling
This post shows how to reverse engineer the high-level architecture of a Linux application by profiling it to find the high-level components taking up the program's execution time, and the common call-graphs through the app.
In my previous "Profiler UI Roundup" post, I showed a variety of Profiler UIs, settling on Firefox Profiler as my favourite. In this post we will apply Firefox Profiler to analyse a real-world binary.
Lately, I've been working on improving Graphviz's docs, but I don't really have a good idea of Graphviz's high-level architecture, where it spends time, and how it ticks. I hoped that profiling Graphviz might yield some insights and understanding.
In this example I'm profiling an old version of Graphviz – v2.43.0, because that's what I have pre-installed on my Ubuntu Focal machine. This should be good enough for figuring out Graphviz's high-level architecture, because it hasn't changed much lately.
My First Profiling Attempt
Record at 4000Hz -F 4000, with stack frames -g, outputting to ninja.data, running Graphviz dot on the "Ninja build system" example:
$ sudo perf record -F 4000 -g -o ninja.data dot -Tsvg ninja.dot
Then convert the output, filtering to only processes with command-line equal to dot (to get rid of perf profiling itself), outputting to a txt file with PIDs as per the instructions for importing perf profiles into Firefox Profiler:
$ sudo perf script --comms=dot -F +pid -i ninja.data > perf_ninja.txt
The sudo is a bit naughty; I shouldn't really need to run Graphviz as root, but I need to run perf with elevated permissions. It's a little risky running an C program like Graphviz as root, but I couldn't be bothered dropping permissions, and I trust the input. Oh well.
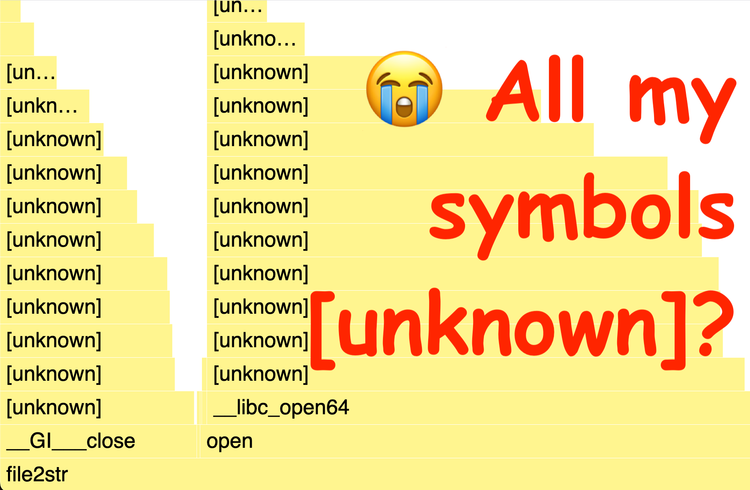
This profile output had a lot of [unknown] stack frames with no function names, but the frames did give a clue, pointing to which shared libraries they came from:
/usr/lib/x86_64-linux-gnu/libpango-1.0.so.0.4400.7
/usr/lib/x86_64-linux-gnu/libexpat.so.1.6.11
/usr/lib/x86_64-linux-gnu/graphviz/libgvplugin_dot_layout.so.6.0.0
/usr/lib/x86_64-linux-gnu/graphviz/libgvplugin_pango.so.6.0.0
/usr/lib/x86_64-linux-gnu/libgvc.so.6.0.0
/usr/lib/x86_64-linux-gnu/libfontconfig.so.1.12.0
Installing Debug Symbols
I could resolve many of these by installing "debug symbols", which is fairly straightforward on Ubuntu. To find the symbol package, I Googled for [library name Ubuntu package],then suffixed the package name with -dbgsym:
sudo apt install \
  graphviz-dbgsym \
  libpango-1.0-0-dbgsym \
  libexpat1-dbgsym \
  libpangoft2-1.0-0-dbgsym \
  libgvc6-dbgsym \
libfontconfig1-dbgsymAfter installing symbols, the profile started showing function names for many libraries. But I still had the 'root' of the stack having a lot of [unknown] symbols:
Working around lack of Frame Pointers
I suspected, from reading Brendan Gregg's perf examples, that the Graphviz binary was compiled with -fomit-frame-pointer, which ruins stack trace reconstruction by overwriting the "frame pointer" register used by stack unwinding, by using the frame pointer register as another general-purpose register. This optimisation is commonly used by -O2 optimisations in C compilers (see GCC Manual).
To track down the C Compiler flags used, I found the package on Ubuntu Launchpad (kind of like Ubuntu's GitHub – where all their source lives): https://launchpad.net/ubuntu/+source/graphviz. Clicking the package for Ubuntu "Focal Fossa" gives me the build for my OS, and you can click through the amd64 build to get the build logs.
The build logs indeed seem to be setting -O2 with GCC:
CFLAGS=-g -O2 -fdebug-prefix-map=/<<PKGBUILDDIR>>=. -fstack-protector-strong -Wformat -Werror=format-securityAnd there is no mention of -fno-omit-frame-pointer, so I think frame pointers are gone in this binary.
Brendan Gregg's perf examples page recommends trying a workaround if there are no frame pointers: using perf record --call-graph dwarf, to unwind the stack using DWARF debugging information. I don't really know what this means, but let's try it:
$ sudo perf record -F 4000 -g --call-graph dwarf -o ninja.data dot -Tsvg ninja.dot
$ sudo perf script --comms=dot -F +pid -i ninja.data > perf_ninja.txt
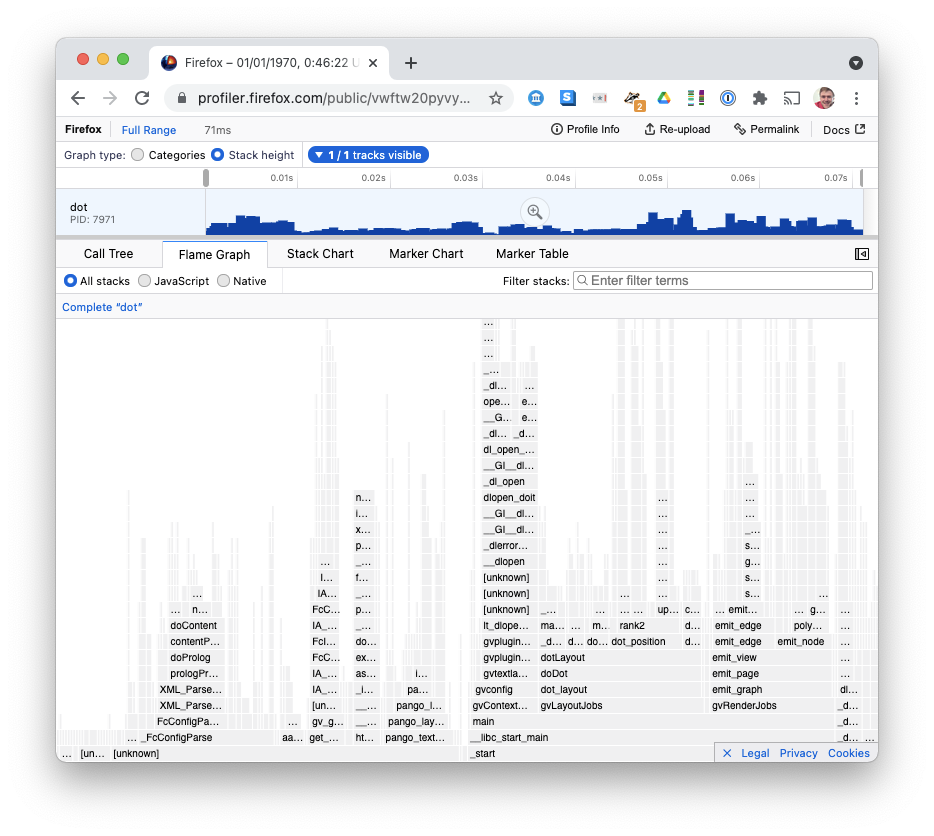
This worked! We now see detailed function names:
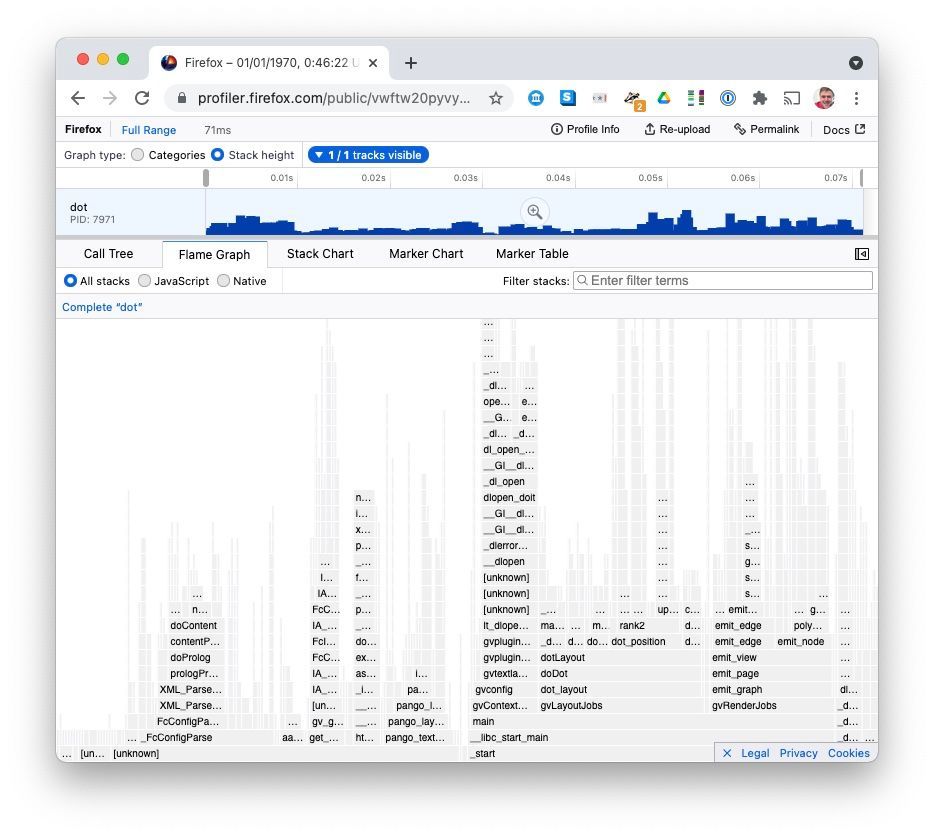
main calls gvLayoutJobs calls dot_layout... it worked! Open in Firefox ProfilerInterpreting the Profile
Open the output yourself in Firefox Profiler: https://share.firefox.dev/3trjZLz and you can play along.
Let's see what we can learn from Graphviz's architecture from this profile:
Let's look at some of the top-level "towers" in this Flame Graph:
2ms in _dl_start
This is loading dynamic libraries, I think:
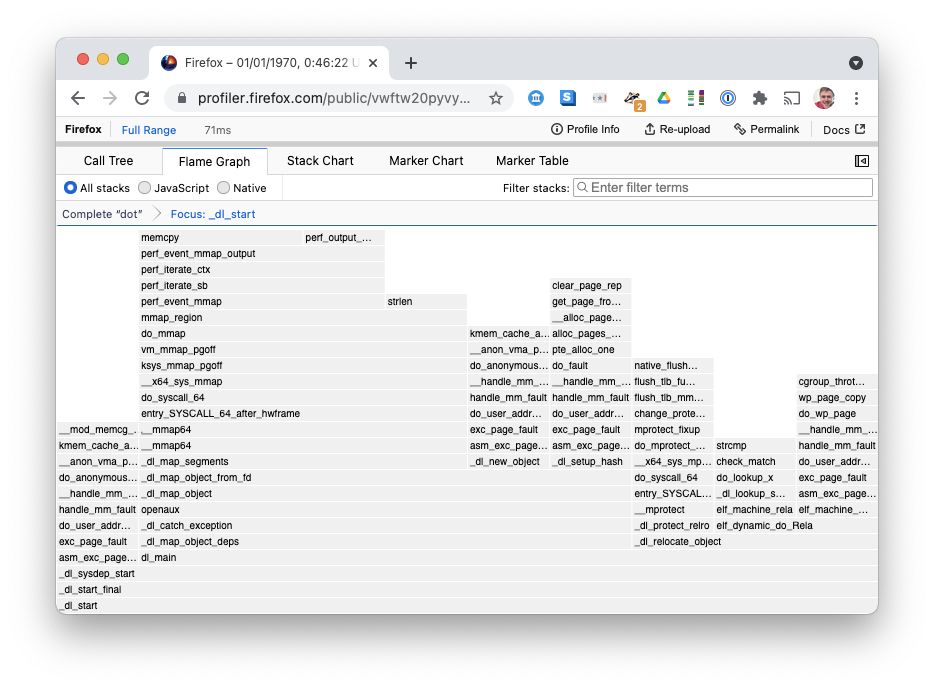
I think this is just a normal thing that C programs do on systems like Ubuntu that ship with a lot of dynamic libraries? Anyway, it's not that interesting.
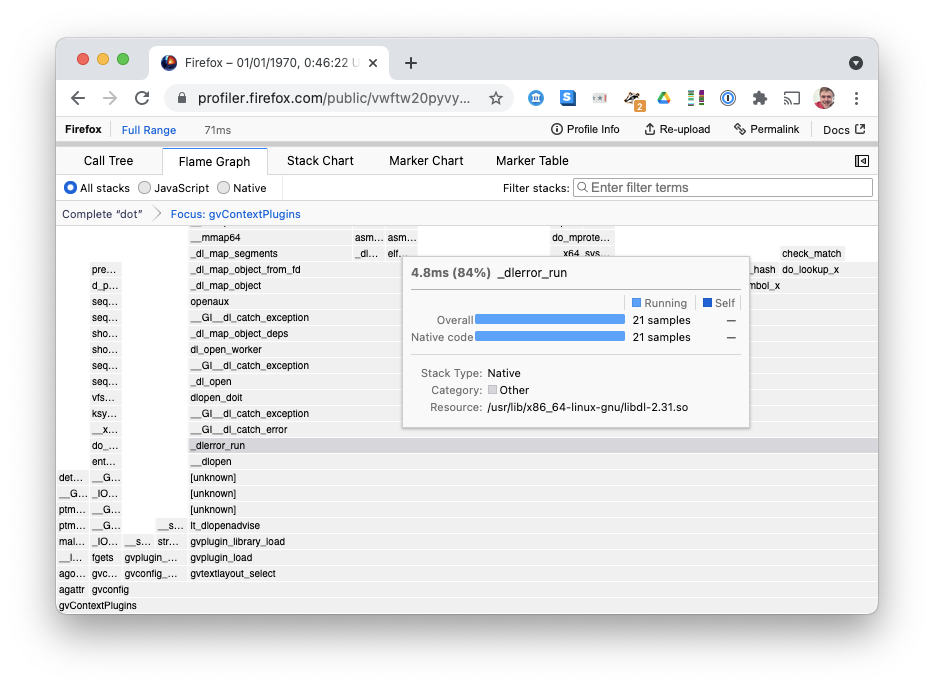
6ms in gvContextPlugins
This is also loading dynamic libraries, but here I think the libraries are Graphviz output formats, perhaps?
2ms in aagparse
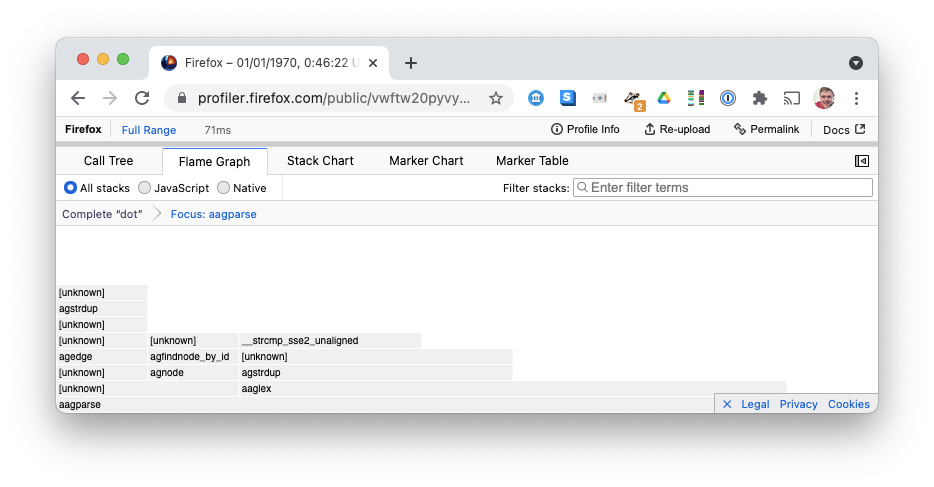
I think this is parsing the dot language input? I see lexing, and a bunch of [unknown] frames, so I suppose my stack unwinding isn't perfect.
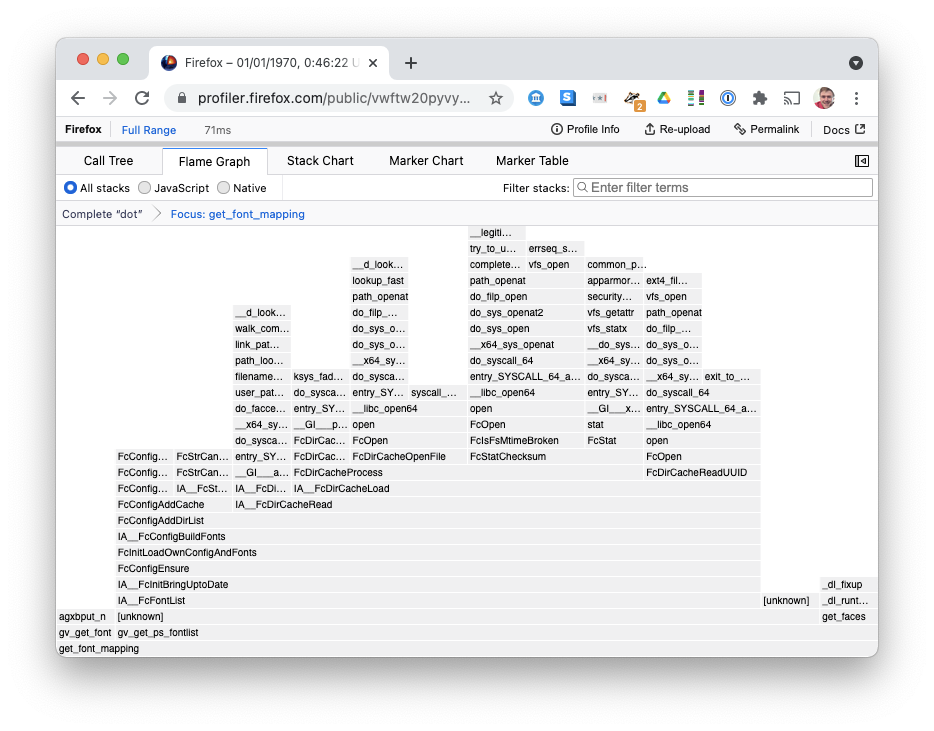
12ms in _FcConfigParse
I think this is loading "Font Configs". Right-click and "Focus on Function" zooms in:
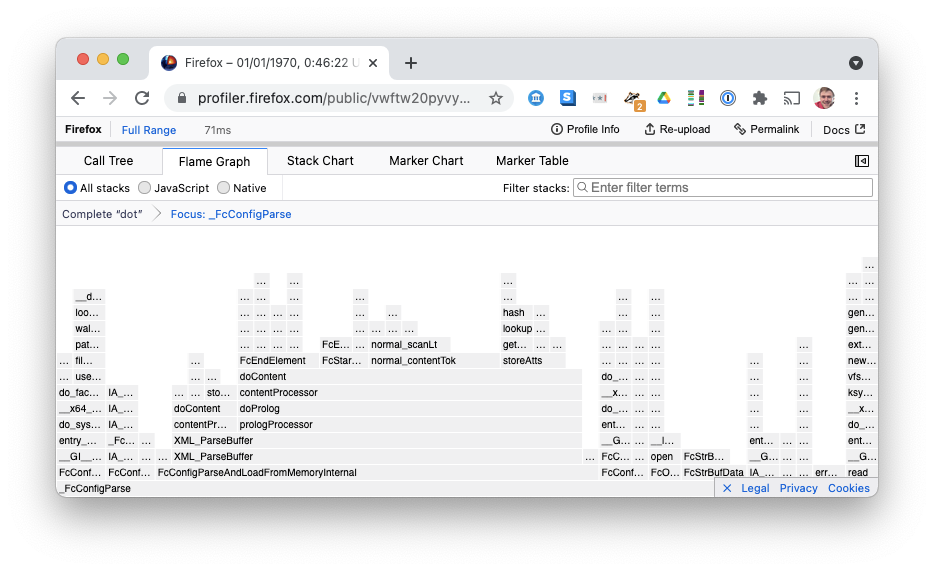
Most of the time is spent in XML_ParseBuffer, which surprisingly (to me) calls prologProcessor, in libexpat. At first I thought this might be the PROLOG logic language (that would be fun), but it's probably just the XML "Prologue".
3ms in get_font_mapping
This seems to be doing something to do with fonts, and there's some caching of fonts happening – see the big FcDirCacheRead block.
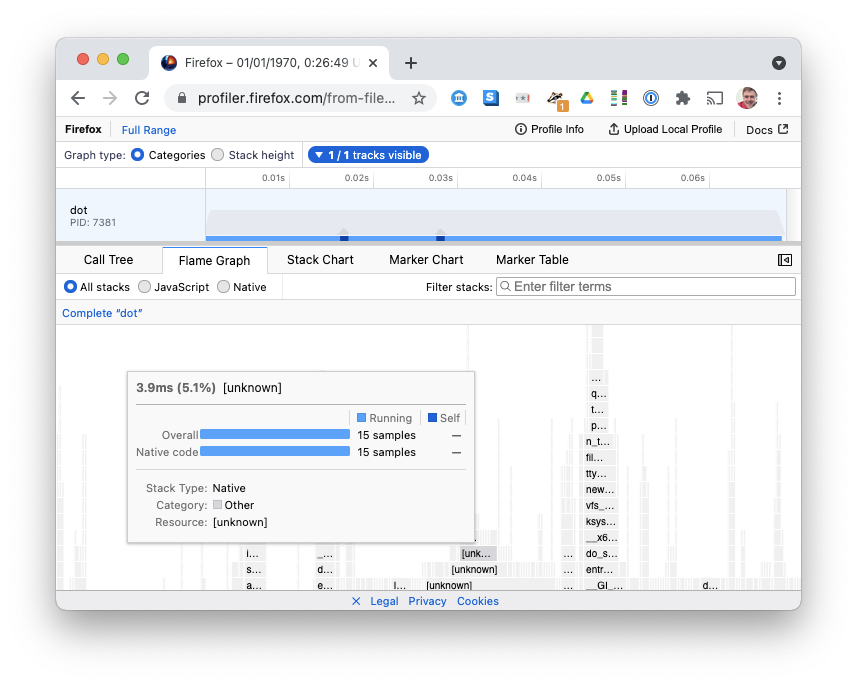
7ms in pango_textlayout
Pango is a library for rendering text. Even though I'm using SVG output, which doesn't really render text to pixels, I assume Graphviz here is measuring the text for layout?
The root of the stack here is [unknown] which is a little frustrating; I'd love to know what function is calling this.
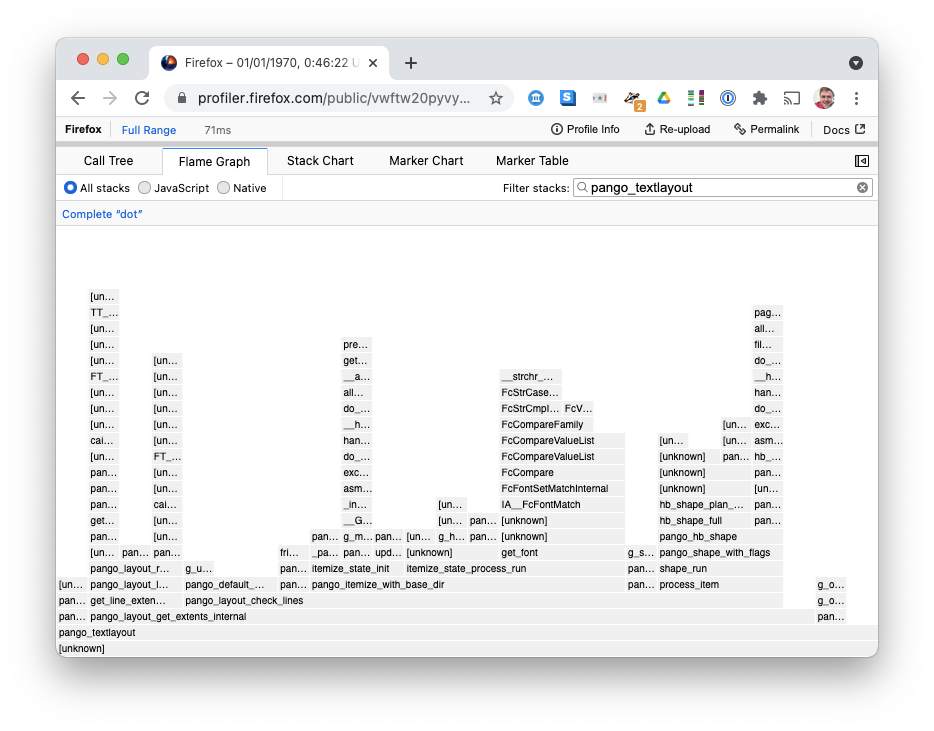
There are some tall [unknown] towers, which hovering shows as "libfreetype" which I didn't bother installing debugging symbols for.
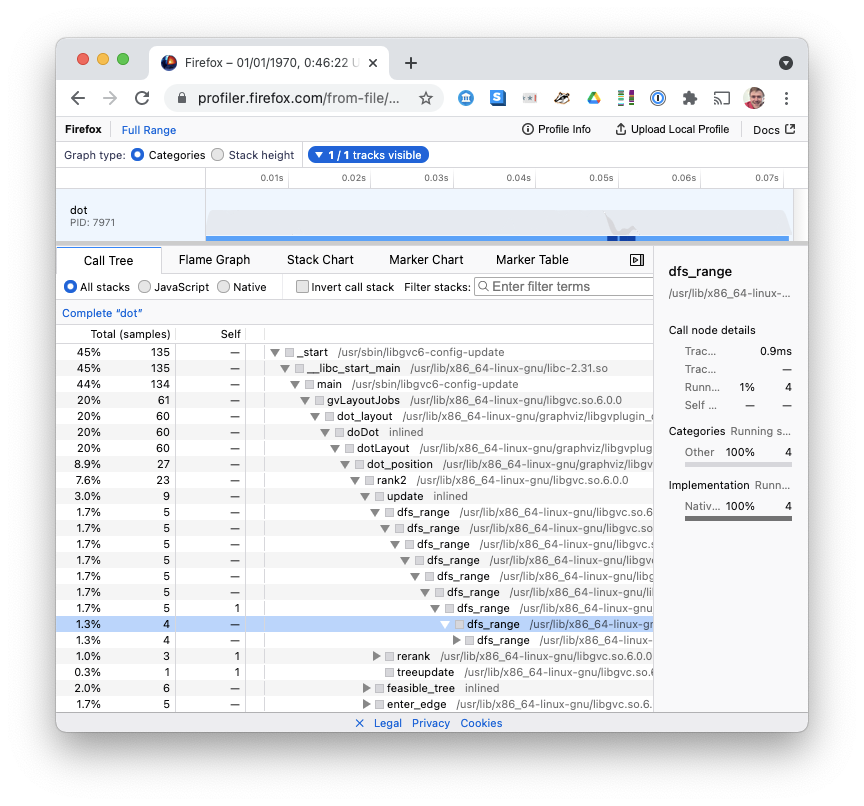
14ms in gvLayoutJobs
This is the real 'business logic' of Graphviz: laying out a graph, with nodes and edges, on a 2D space. We see:
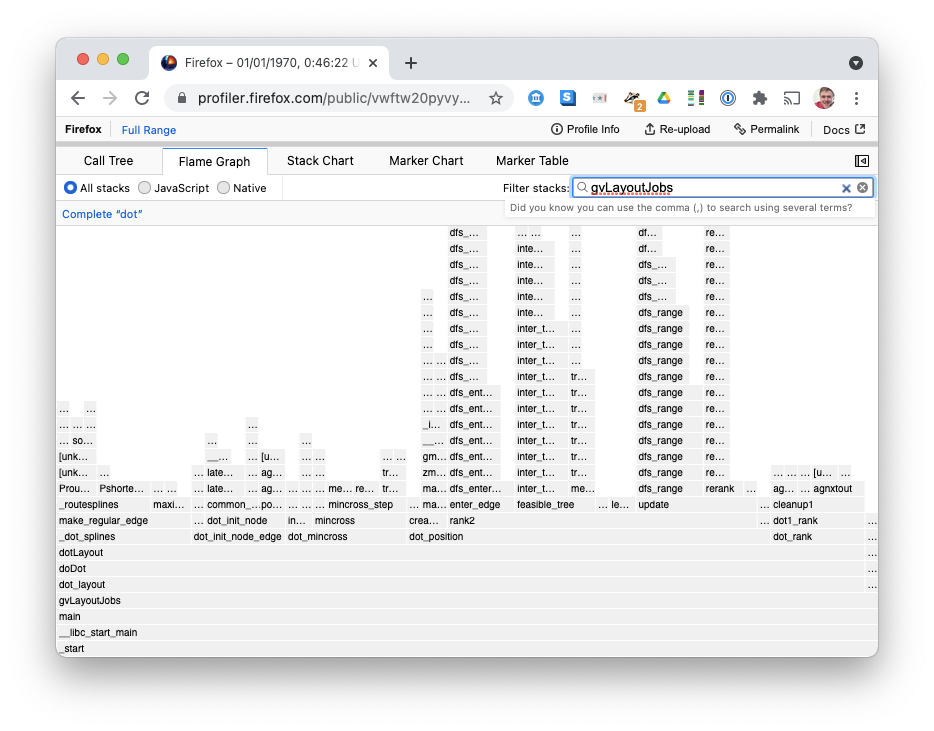
- several tall
dfstowers (recursive depth-first searches). Maybe it's worth turning these into iteration; we might blow the stack on arbitrary graphs rerankandinter_tree_edge_searchalso look like recursive algorithms- A few unknown symbols in
libcdtwhich show as...I should probably install debugging symbols for - The
mincrossand_routesplinesalgorithms look important – perhaps this layout is trying to minimise crossing lines.
11ms in gvRenderJobs
Once layout has finished, it's up to the output format plugin (in this case, SVG) to render the nodes and edges:
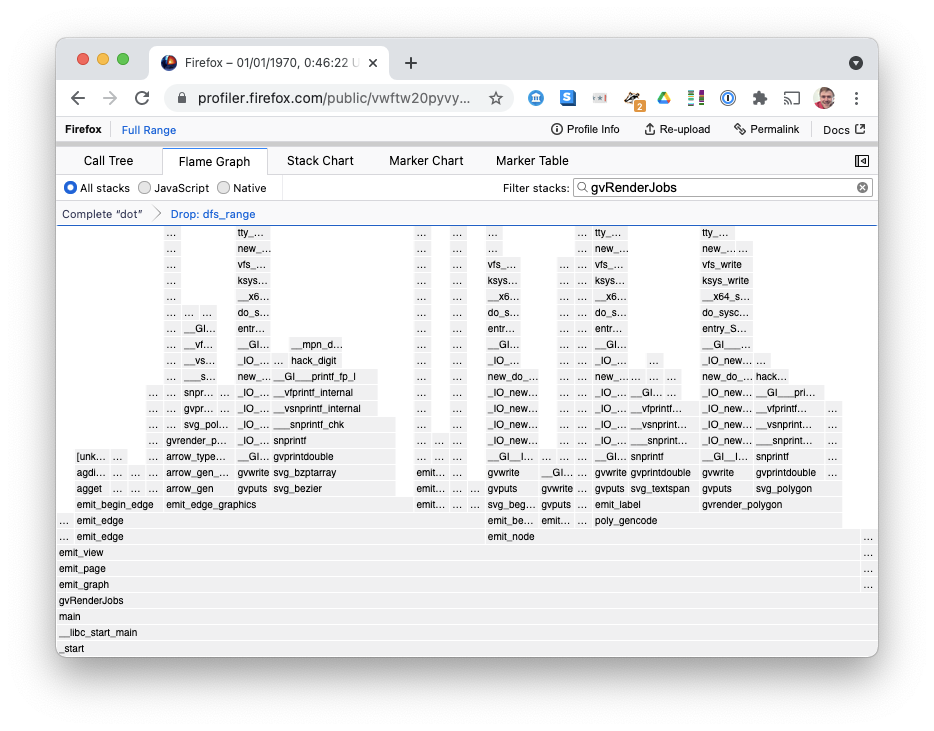
Here we see:
- Generic methods like
emit_edgeandemit_nodecalling output-format-specific methods likesvg_bezier,svg_polygon, andsvg_textspan. This gives a clue to the structure of Graphviz's output format plugin architecture. - A lot of time spent in
_IOmethods, which top out atwritesyscalls. This shouldn't be surprising, I suppose – this is writing to the filesystem. Although perhaps there are some buffering opportunities to reduce time in these syscalls? - The SVG output plugin leans heavily on
snprintf.
Conclusions / Further Work
Reading a profile that shows you the important "hot" areas of the code can be a lot easier than figuring it out by reading the code.
You could use this technique to learn the high-level architecture of any native app, not just Graphviz, as long as you can install debug symbols.
This was a fairly short profile, taking only about 78ms. A more complex input example would allow the sampling profiler to sample more of the methods, giving a better overview. But at 4000Hz we still got a 312 samples and enough to get an idea of the app architecture.
The Firefox Profiler has wide applicability for profiling many apps, not just Firefox.


Comments ()