Attributing Latency in Go with Pprof Tags
A latency analysis of a Go program (Hugo), starting with in-app wall-clock counters, then pprof CPU profiling, then adding custom dimensions to slice the profile.
Background
I recently migrated Graphviz's docs from Jekyll to Hugo, in part because the Hugo static-site-generator was faster.
However, recently our Hugo build time has been creeping up, it now takes 13 seconds, which is beginning to feel a bit slow when editing and previewing:
$ hugo ~/projects/graphviz.gitlab.io
Start building sites …
hugo v0.88.1+extended darwin/amd64 BuildDate=unknown

                   | EN
-------------------+------
  Pages            | 634
  Paginator pages  |   0
  Non-page files   | 146
  Static files     | 349
  Processed images |   0
  Aliases          |  72
  Sitemaps         |   1
  Cleaned          |   0

Total in 13482 ms
I'd like to know why this is slower. Making this a bit trickier, Hugo uses parallelism heavily: with a pool of Goroutines processing each page in parallel.
--templateMetrics
Hugo can count the clock duration spent processing per-template. Here's the top 5 output:
$ hugo --templateMetrics ~/projects/graphviz.gitlab.io
Start building sites …
hugo v0.88.0-DEV darwin/amd64 BuildDate=unknown

Template Metrics:

     cumulative       average       maximum
       duration      duration      duration  count  template
     ----------      --------      --------  -----  --------
  31.661835379s   95.655091ms  243.928529ms    331  partials/sidebar.html
  31.531966131s   95.262737ms  243.832708ms    331  partials/sidebar-tree.html
  20.116633209s  116.957169ms  221.516518ms    172  attrs/single.html
   4.113334482s  132.688209ms  221.705938ms     31  attr-types/single.html
   4.051019586s  112.528321ms  212.598791ms     36  output/single.html
   [...]
This is a pretty good start, far better than most software. We can see the effect of parallelism: the overall build takes 13s wall-time, but we see that we've spent 31s processing partials/sidebar.html alone!
This gives me some pointers – perhaps I should focus on sidebar.html, sidebar-tree.html. But perhaps they're just so large because they are the sidebar, rendered for every page? They are invoked 331 times. attrs/single.html is another cumulative duration offender at 20s, but perhaps it's justified given we have 172 pages using this template?
This view is useful, but limited, in particular, it doesn't tell us why these pages are slow.
--profile-cpu
Let's go a bit deeper than just at the template-level, and see if we can see some patterns in the functions executed.
Go has a built-in sampling CPU profiler, which outputs profiles in pprof format. Hugo supports invoking this using the --profile-cpu flag, and we can open the profile with go tool pprof:
$ hugo --profile-cpu /tmp/pprof
[...]
Total in 12100 ms

$ go tool pprof /tmp/pprof
Type: cpu
Time: Sep 18, 2021 at 8:24am (AEST)
Duration: 11.97s, Total samples = 22.06s (184.34%)
Entering interactive mode (type "help" for commands, "o" for options)
(pprof)
Here we start to see the effects of parallelism, from duration: 12s, total samples: 22s – on average using 184%, or on average executing across 1.86 CPUs.
The pprof profiler only samples threads when they are executing on-CPU, and excludes time spent blocked waiting for IO or mutexes. This pprof profile reports 24s of samples, even though above we saw --templateMetrics saying that 31s wall-time was spent processing sidebar.html alone!
It's always important to remember the distinction between wall-time profiling and on-CPU-profiling. Wall-time profiling is most useful for profiling user-visible latency, and on-CPU-profiling is useful for reducing CPU utilisation. Often you care about both, and want to look at both.
Let's open an execution-time callgraph in the browser. I've simplified the graph here by limiting to 20 nodes, otherwise it doesn't fit in the blog so well:
(pprof) nodecount=20
(pprof) web
Redder, thicker, larger lines and nodes are more common in the profile, and dotted lines represent nodes that have been removed. See: docs on how to interpret the callgraph.
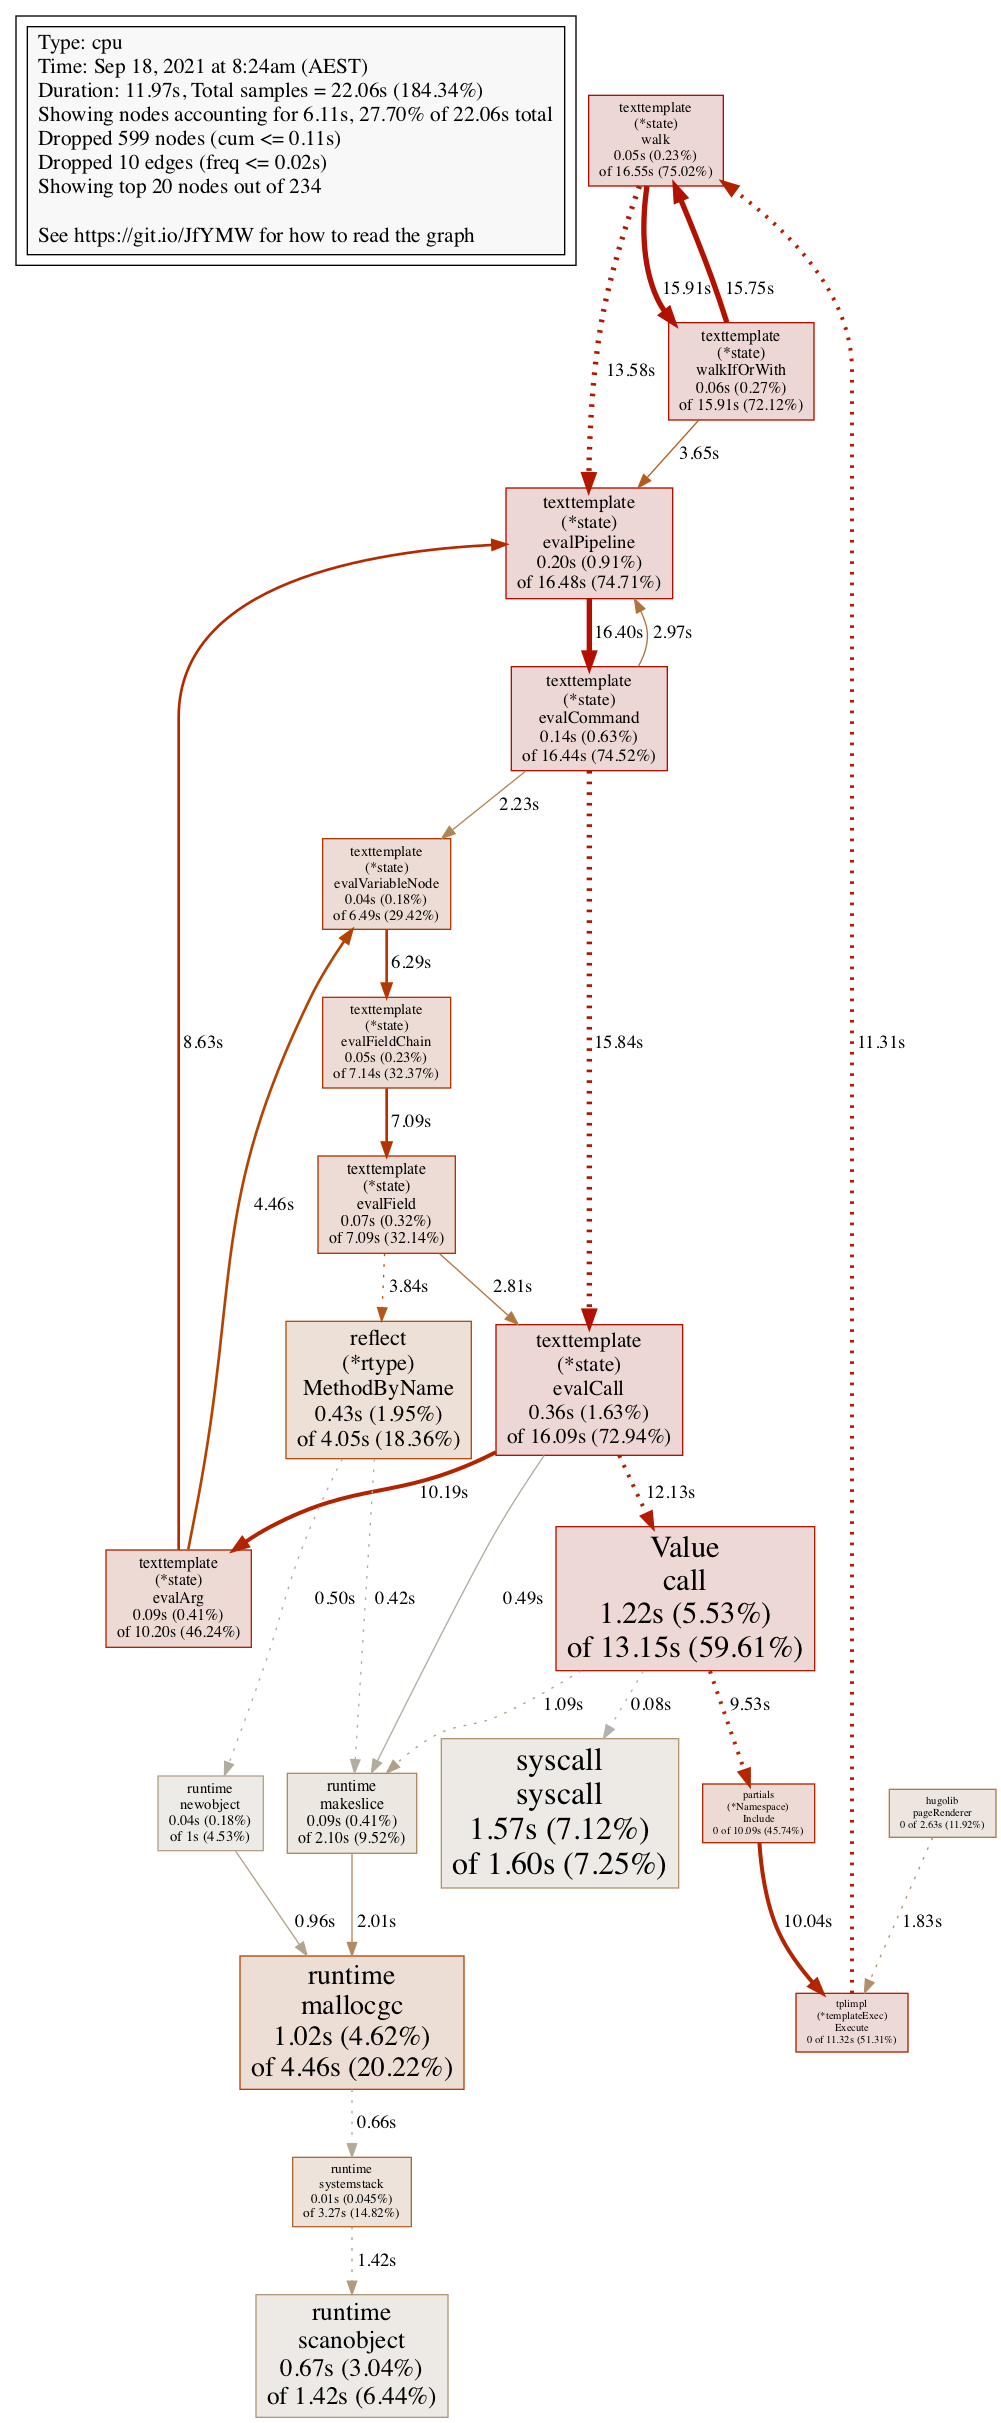
This shows us a lot of time spent in texttemplate functions, a bit of time in reflect, syscall and memory allocation.
However, we don't have any information about what source templates are driving this. Hugo is kind-of a language interpreter, and this is a common problem when profiling any interpreted language: the profiles only show up the interpreter code, unable to measure the code being interpreted – in our case, the HTML templates driving the template engine.
Fun thought: an ahead-of-time (or even JIT-) compiled templating engine would be trivially profileable. Some templating engines do this!
Custom Go Pprof Profile Labels
Can we relate this profile back to the templates and inputs driving the interpreter? Yes, with Go's "Profile Labels", which output per-sample "tags" into the pprof output.
In Hugo's page-renering code, construct a set of string key-value pair labels with pprof.Labels, then wrap the current context.Context with pprof.Do:
labels := pprof.Labels(
	"target_filename", targetPath,
	"section", p.Section(),
        "template", t)

pprof.Do(ctx, labels, func(ctx context.Context) {
	[... compile the page ...]
})
This tags each CPU sample with the filename of the page we're compiling, the template, and the top-level section of the site. Then grab a profile:
$ hugo --profile-cpu /tmp/pprof
[...]
Total in 13617 ms

$ go tool pprof /tmp/pprof
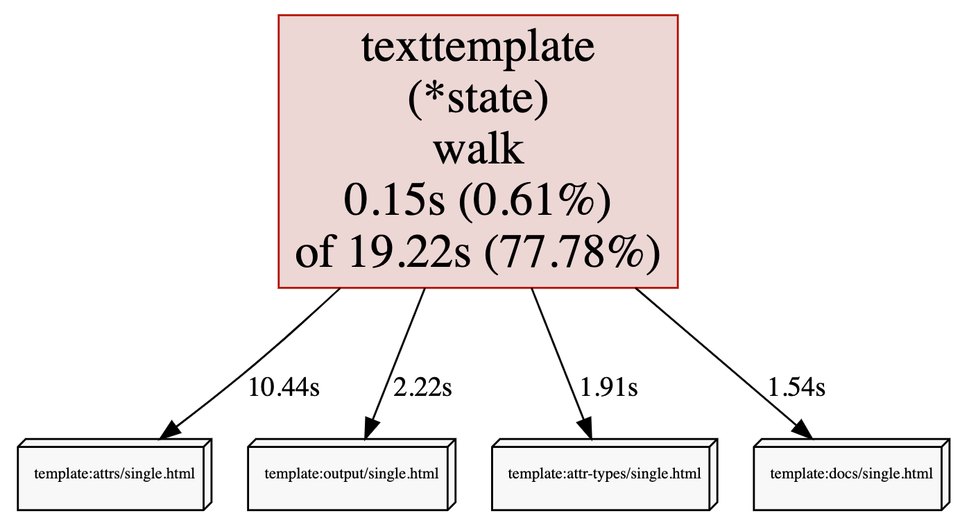
We can now see the tags we just added, breaking down CPU by template, like the output of --templateMetrics above:
$ go tool pprof /tmp/pprof
(pprof) tags
 template: Total 18.0s
             10.5s (58.11%): attrs/single.html
              2.2s (12.33%): output/single.html
              1.9s (10.67%): attr-types/single.html
              1.6s ( 9.00%): docs/single.html
           740.0ms ( 4.11%): Gallery/single.html
                             [...]
Breaking down CPU by individual page, we see that /faq is the most expensive single page:
target_filename: Total 18.1s
                  180.0ms ( 0.99%): /faq/index.html
                  130.0ms ( 0.72%): /docs/attr-types/startType/index.html
                  130.0ms ( 0.72%): /docs/attrs/arrowtail/index.html
                  120.0ms ( 0.66%): /docs/attrs/sides/index.html
                  120.0ms ( 0.66%): /docs/outputs/json/index.html
                                    [...]
Breaking down CPU by top-level site section, we see docs section is most expensive:
 section: Total 17.5s
            16.1s (91.88%): docs
          900.0ms ( 5.15%): Gallery
          210.0ms ( 1.20%): Misc
          130.0ms ( 0.74%): build
          130.0ms ( 0.74%): download
           50.0ms ( 0.29%): _pages
Using these tags, we can drill-down to profile generating a single page, e.g. /faq/index.html (simplified for the blog to 15 nodes):
(pprof) tagfocus=target_filename=/faq/index.html
(pprof) nodecount=15
(pprof) tagshow=none
(pprof) web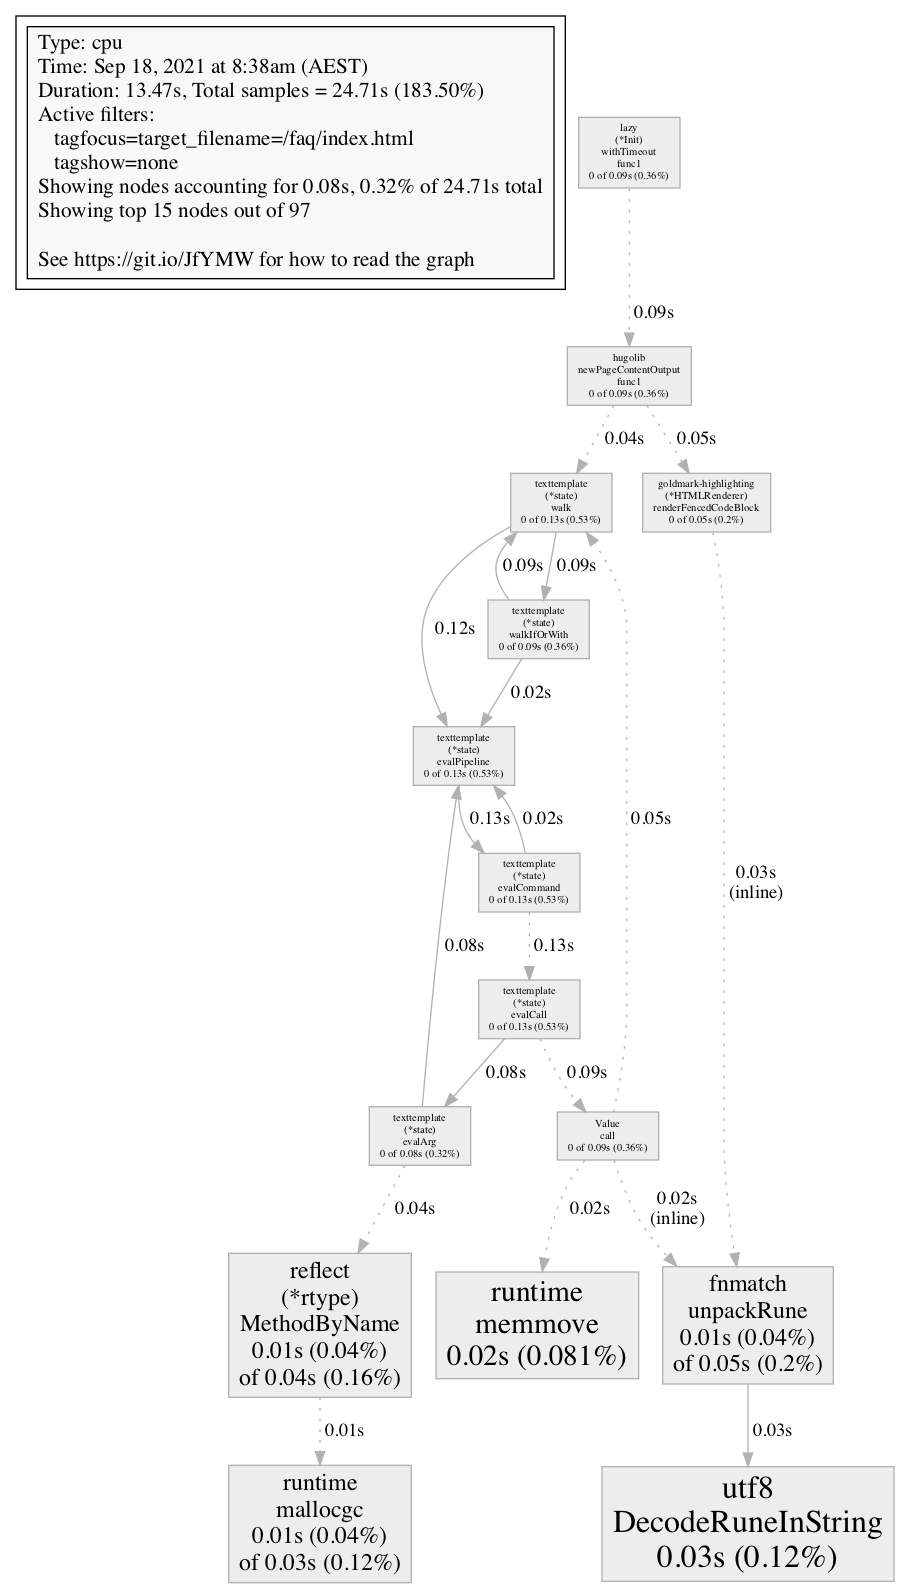
Here we see about half the time (.05s/.09s) compiling /faq/index.html is spent in the right-hand branch, calling goldmark-highlighting.RenderFencedCodeBlock.
Now we know why FAQ is slower to compile than other pages: because there is much more syntax highlighting.
I've sent a pull request to add these labels to Hugo.
Conclusions
- Go's pprof Labels can help you drill-down and slice your profiles by whatever dimension you choose. If your labels have higher cardinality, your profiles will have higher overhead.
- Go's pprof Labels don't require much code to integrate.
- I still don't really understand why the site got slower to build. More work is needed to relate the time taken to template code.
- pprof CPU-time profiles, in a parallel system, are insufficient to understand the wall-clock critical path. We may need either multi-track tracing, or pprof profiles weighted by wall-time.

Comments ()