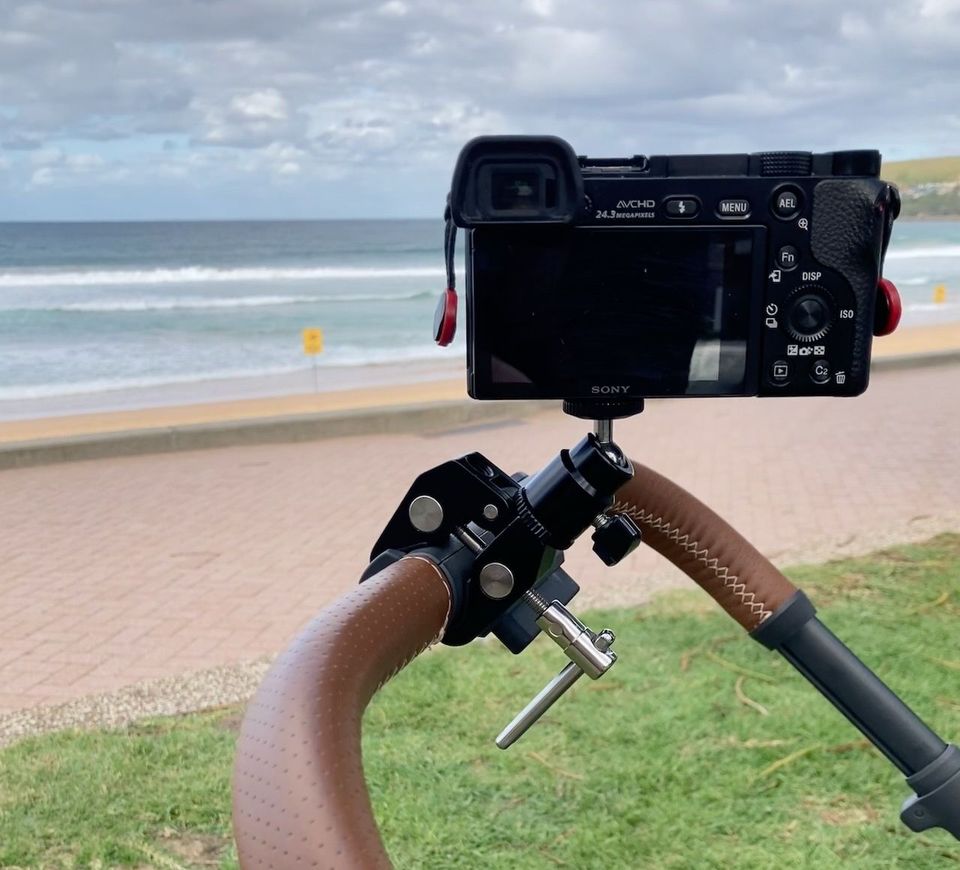
Pram/Stroller Camera Mount Apr 24, 2023 3 min read Photography How to mount a heavy-ish mirrorless camera to a pram/stroller with a cheap clamp and ball mount.
Mastodon Account Verification with Ghost Blog Mar 31, 2023 2 min read Programming How to get a green verification checkmark on Mastodon from your link to your Ghost blog. Inject a link tag in your site header.
CAP Theorem & UI Programming Mar 4, 2023 3 min read Android When the network doesn't respond, will you wait forever, blocking the app (and your users), sacrificing availability? Or will you make up an answer (show inconsistent data)?
Should you inflate Android Views on a background thread? Feb 18, 2023 2 min read Programming TL;DR: No, it's not safe. I show race conditions that could happen to any View, and consider AsyncLayoutInflater.
Choosing a Portmanteau/Blended Baby Surname Feb 15, 2023 5 min read Baby How we chose a surname for our new baby: options, tradeoffs, and how to search for blends of your & your partner's surnames