Electricity Monitoring with Tasmota & Prometheus
This post is about graphing power draw of appliances using a smart plug, Prometheus time-series database, and Grafana dashboards.
First, you'll need a smart plug that you've flashed to the Tasmota open source firmware. In Part 1, I re-flashed some cheap Kogan smart plugs.
Build Tasmota with Prometheus enabled
Tasmota has a Prometheus exporter, exposing metrics over the /metrics HTTP endpoint, but that exporter isn't included in the standard firmware builds, because Tasmota's trying to minimize their firmware size to fit on many devices.
You have to build your own Tasmota with #define USE_PROMETHEUS to enable the feature. I took the opportunity to put the Wi-Fi SSID and password into the firmware image too:
// tasmota/Tasmota/user_config_override.h
#ifndef _USER_CONFIG_OVERRIDE_H_
#define _USER_CONFIG_OVERRIDE_H_

#define USE_PROMETHEUS
#define STA_SSID1 "Free Public WiFi"
#define STA_PASS1 "hunter2"

#endif  // _USER_CONFIG_OVERRIDE_H_
I followed the guide for building with Visual Studio Code. It's surprisingly straightforward: you install the "PlatformIO IDE" extension, and then run Ctrl-Shift-P "PlatformIO: Build". No need to manually install compiler versions, PlatformIO extension takes care of that.
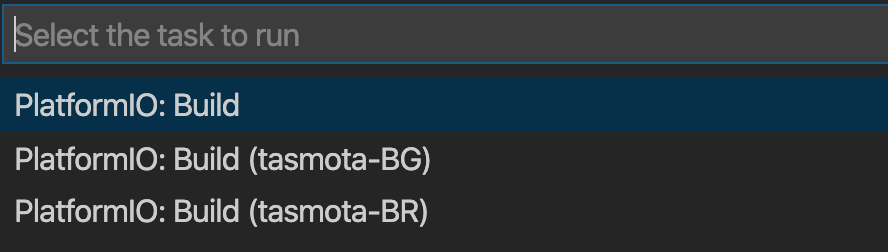
To tell PlatformIO which configurations to build, I uncommented tasmota and tasmota-minimal in platformio.ini.
default_envs =
; *** Uncomment by deleting ";" in the line(s) below to select version(s)
                tasmota
;                tasmota-ircustom
                tasmota-minimal
;                tasmota-lite
I tried some other ways to build first, like this web UI for building Tasmota, but I didn't know if my smart plug was 80MHz or 160MHz and it was making me choose.
Reflash to Tasmota with Prometheus
If the build succeeds, you should have the following files:
.pioenvs/tasmota-minimal/firmware.bin
.pioenvs/tasmota/firmware.bin
You must first flash the tasmota-minimal image, then the large tasmota image. I suppose this is due to flash memory limitations.
You can flash through:
- File Upload: you can upload the firmware directly to the smart plug. This is manual, but straightforward.
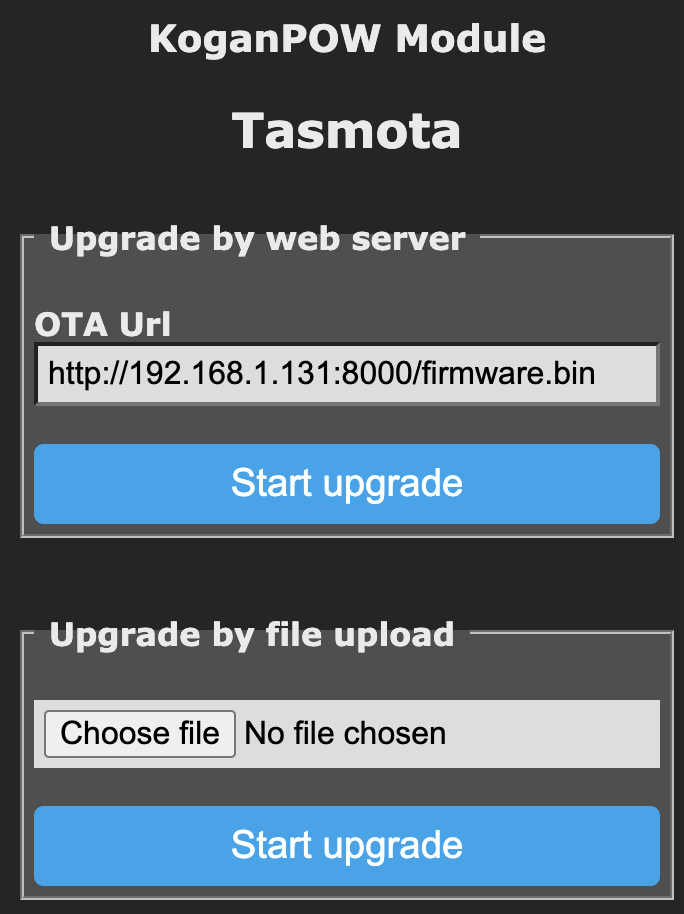
- Web Server: the smart plug can fetch firmware over HTTP. Tasmota is smart enough to first fetch the minimal firmware then the full firmware later. This is more automated, but a little harder.
To do the latter, I set up a lightweight Python HTTP server on my laptop hosting firmware-minimal.bin and firmware.bin:
$ mkdir /tmp/tasmota
$ cp .pioenvs/tasmota-minimal/firmware.bin /tmp/tasmota/firmware-minimal.bin
$ cp .pioenvs/tasmota/firmware.bin /tmp/tasmota/firmware.bin
$ cd /tmp/tasmota
$ python3 -m http.server
Then asked Tasmota to fetch from http://196.168.1.100/firmware.bin.
I bricked one device while trying to flash it over the web interface like this. The device was in a far corner of the house with poor Wi-Fi connectivity, and I suspect the HTTP connection cut out midway. So I recommend keeping the device close to the access point while re-flashing!
Configure the Smart Plug
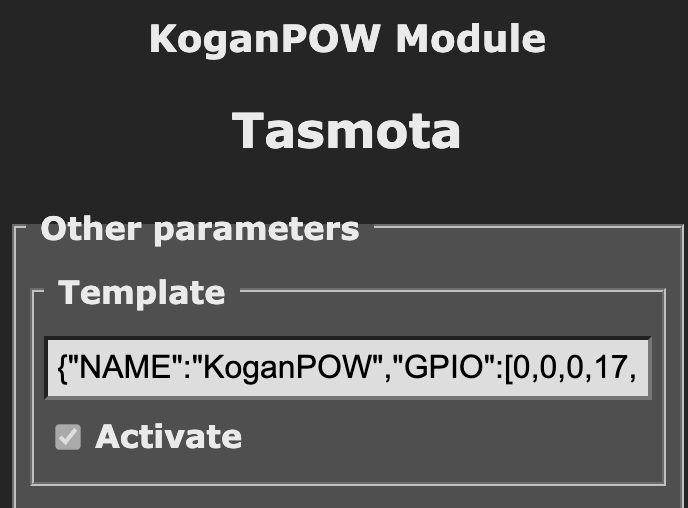
Apply the template for the smart plug. You must tick the "Activate" checkbox for it to work:
Optional: Setup a web username/password for accessing the device. I did this, because I don't want everything on my LAN to be able to turn powerpoints on/off:

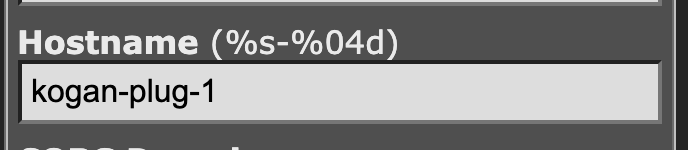
Optional: set a memorable hostname, rather than the default random hostname. I used kogan-plug-1 and kogan-plug-2, but semantic names like fridge-plug and tv-plug would be even better.
Configure Prometheus
Configure your prometheus.yml to start scraping the smart plugs:
scrape_configs:
  - job_name: 'kogan_plug'  # Arbitrary
    basic_auth:
      username: admin
      password: hunter2     # HTTP Basic Auth password
    static_configs:
      - targets:
        - 'kogan-plug-1:80'
        labels:
          location: 'Study'
      - targets:
        - 'kogan-plug-2:80'
        labels:
          location: 'Bar Fridge'
Grafana Dashboards
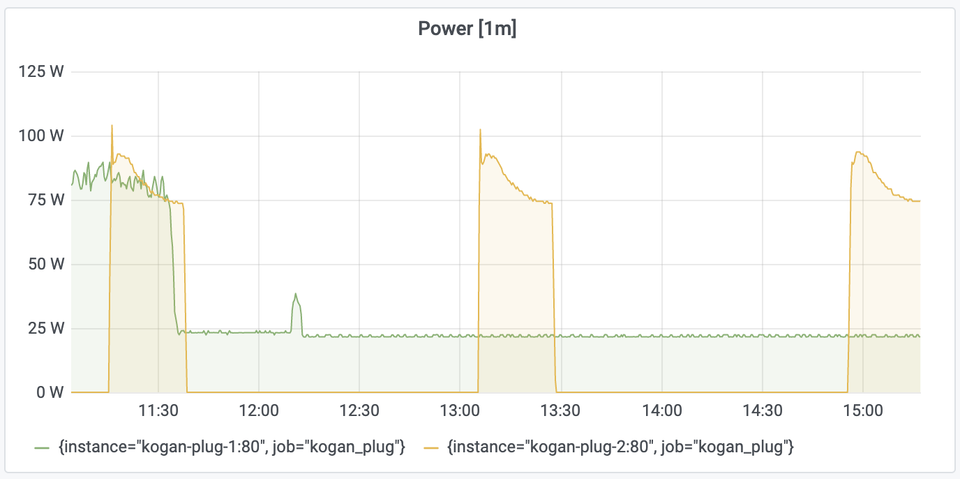
Graph simple expressions, like rate(tasmota_energy_joules_total[1m]) to give you the per-minute Watts of your device output.
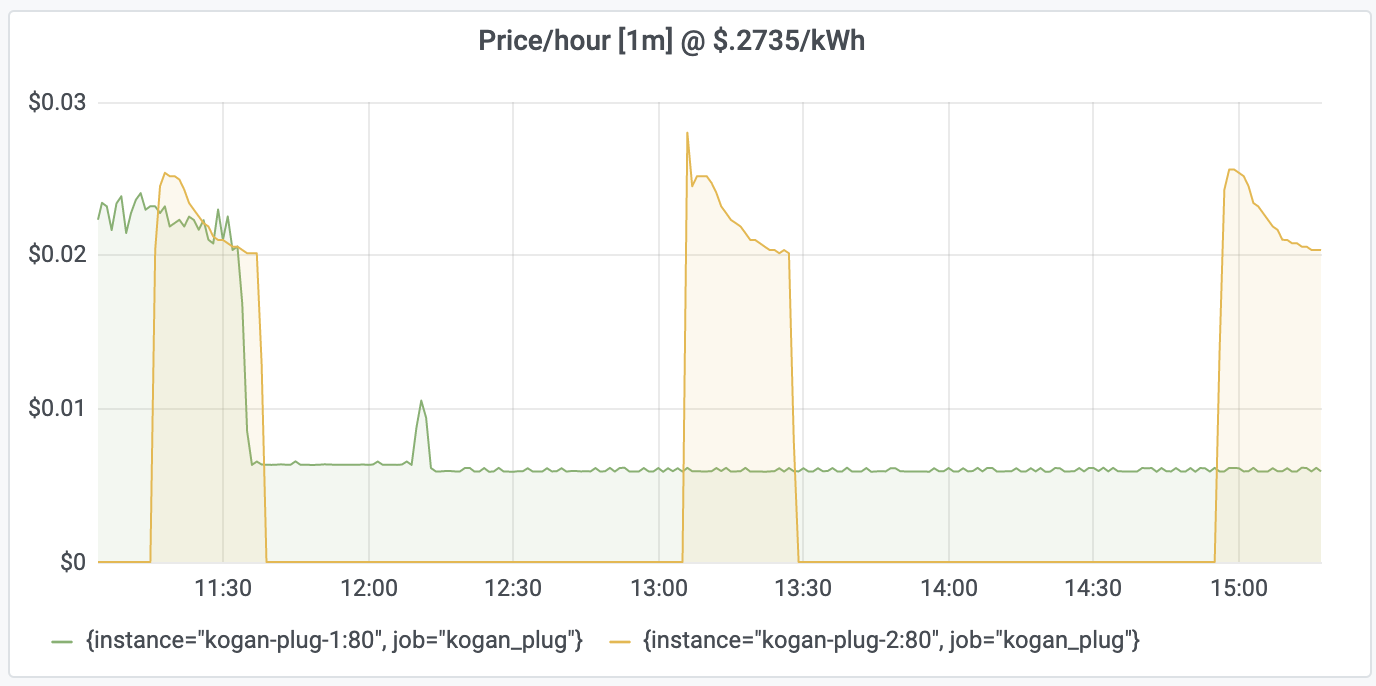
Or complex expressions likerate(tasmota_energy_joules_total[1m]) * .2735 / 1000 to find the $/hour it's costing if your power costs $0.2735/kWh.
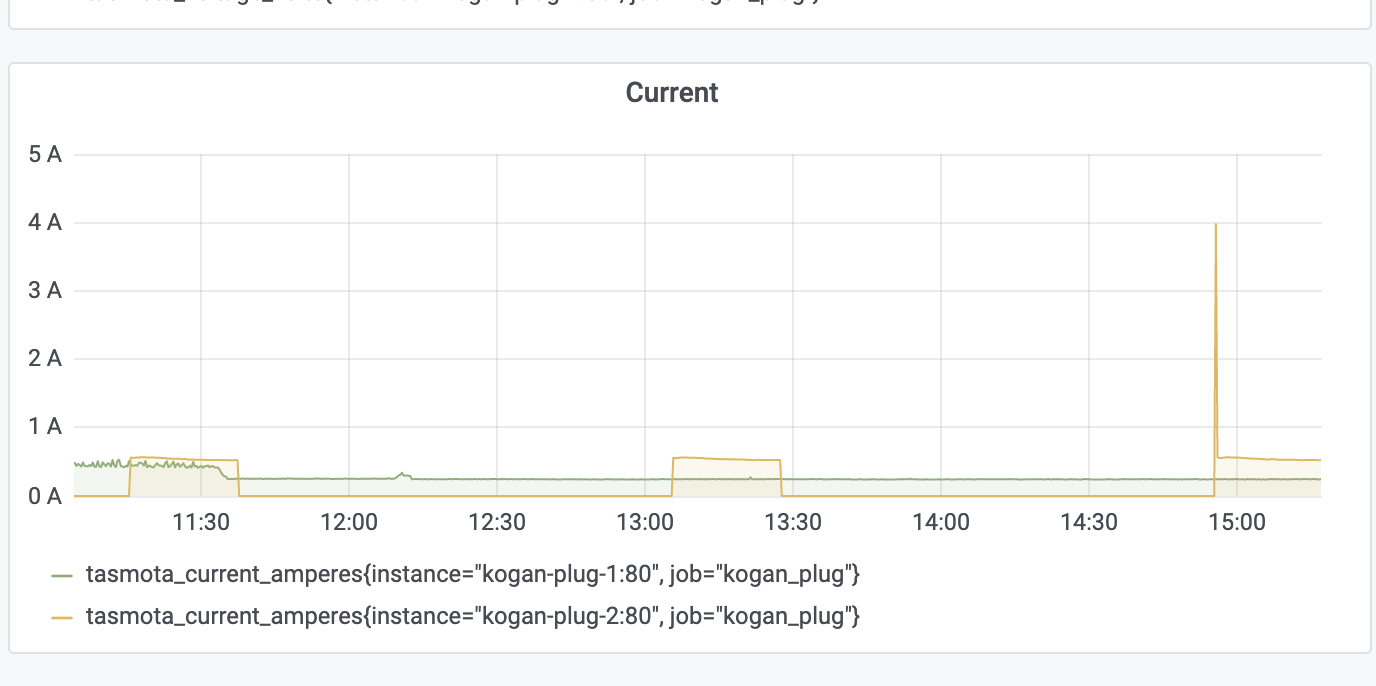
You can graph raw current with tasmota_current_amperes:
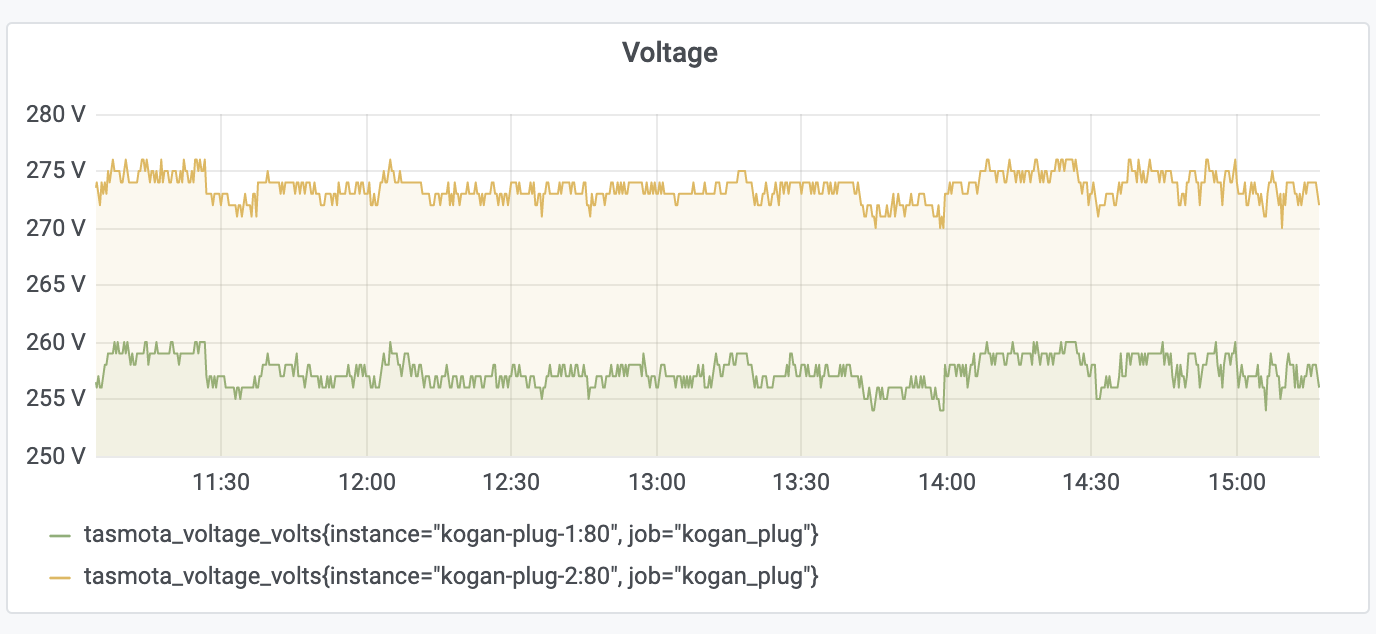
Or Voltage with tasmota_voltage_volts:
Future Opportunities
This is just the beginning, I haven't finished playing with this device yet.
- I hadn't considered ESPHome firmware, an alternative to Tasmota firmware, but it looks like it also has a Prometheus exporter.
- I hear these devices aren't well-calibrated to measure power when they arrive. Perhaps I could calibrate them?
- I still have a few pull requests to make to add more metrics to Tasmota, and convert existing metrics to standard base units. I'll dribble these in as pull requests.


Comments ()