Log backtraces at obfuscated Android methods
Logging a stack trace is a useful way to tell why a method is being called. But it's not always so easy to log a backtrace.
Tools like dtrace and linux-perf can log stack traces when you hit a "tracepoint", which are very helpful for answering questions like "who is filling up this disk", "what is causing so much network traffic". These can be pretty handy for testing hypotheses when seeing production bugs.
I would like to log a backtrace whenever I hit a method in an obfuscated Android app.
If you have the source code to the app, and the app is in debug mode (not obfuscated by ProGuard), this is easy: open Android Studio, click in the left-margin of the source code to add a breakpoint, untick the "Suspend" checkbox and tick the "Logging Options – Stack trace" checkbox.
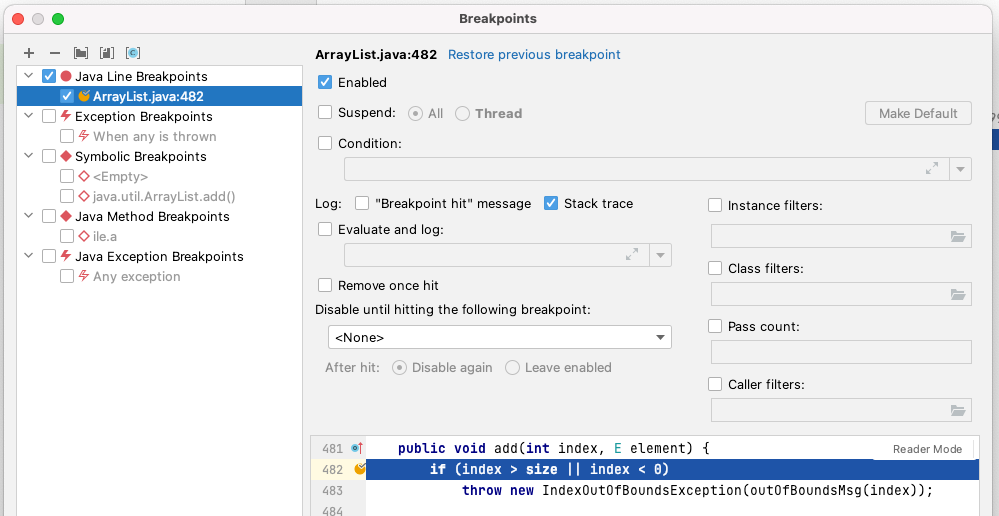
Now whenever the code hits that line, a backtrace will be logged to the debug console.
But if your app is obfuscated, then from the virtual machine's perspective, all the code has obfuscated line numbers like (PG:1), so clicking in the code margin of MyProblematicClass.myProblematicMethod doesn't work. We have the proguard_map.txt, so we know what the function is we want to break on: perhaps MyProblematicClass.myProblematicMethod() maps to ile.a(), and we'd like to log a stack trace anytime that method is hit.
IntelliJ/Android Studio has a "Method Breakpoint" but it's implemented by tracing every method execution in your app, which will make your app grind to a halt. What we really want is to only have the overhead when we hit the method; like a normal line breakpoint does, which keeps performance snappy under debugger.
I couldn't find a way to add a breakpoint on a method name in IntelliJ/Android Studio, nor in Eclipse; both unfortunately seem to assume you will only add a breakpoint by clicking in the margin of a source file.
However, the low-level command-line jdb Java Debugger that ships with the JDK can add a method breakpoint, at low cost. It's a bit janky, but it works. Here's how to use it for Android apps:
First, close Android Studio (it will interfere with the debugger port)
Next, make sure your app is open that you want to trace.
Find your application's process ID:
$ adb shell pidof com.google.android.apps.maps
1160
Verify that this process has JDWP (you have to Ctrl-C after):
$ adb jdwp | grep 1160
1160
^C
Forward a port from your computer to the JDWP of that process:
$ adb forward tcp:8700 jdwp:1160Attach the jdb debugger:
$ jdb -attach localhost:8700
Set uncaught java.lang.Throwable
Set deferred uncaught java.lang.Throwable
Initializing jdb ...
>
If it works, you will get a > prompt. This will hang if you haven't closed Android Studio first.
Set up logging a backtrace every time the app stops at a breakpoint:
> monitor whereTell the app to automatically 'resume' (continue) after logging the backtrace:
> monitor contFinally, attach the method breakpoint:
> stop at ile.a
Set breakpoint ile.a
If your method is overloaded, you will have to specify the overload arguments, like this:
> stop at java.lang.String.indexOf(java.lang.String)
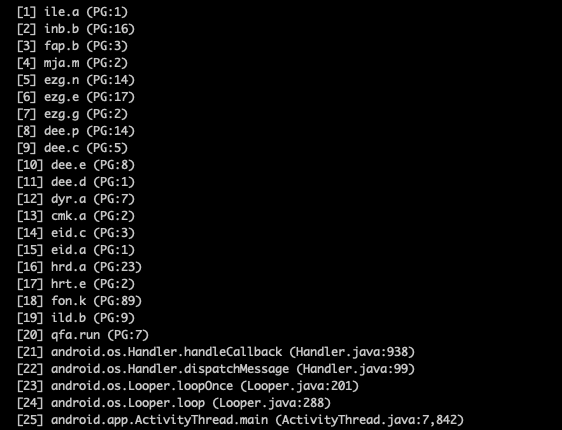
Set breakpoint java.lang.String.indexOf(java.lang.String)All going well, you should now get method backtraces whenever your code hits ile.a():
Breakpoint hit: "thread=ThreadPool3", ile.a(), line=1 bci=0

  [1] ile.a (PG:1)
  [2] inr.b (PG:26)
  [3] lzq.f (PG:61)
  [4] lzq.d (PG:18)
  [5] lmw.run (PG:50)
  [6] irl.run (PG:2)
  [7] isj.run (PG:2)
  [8] java.util.concurrent.ThreadPoolExecutor.runWorker (ThreadPoolExecutor.java:1,167)
  [9] java.util.concurrent.ThreadPoolExecutor$Worker.run (ThreadPoolExecutor.java:641)
  [10] hbj.run (PG:102)
  [11] java.lang.Thread.run (Thread.java:920)
TilePrepPool3[1] > >


Breakpoint hit: "thread=DefaultPool5", ile.a(), line=1 bci=0

  [1] ile.a (PG:1)
  [2] iok.c (PG:1)
  [3] hlz.a (PG:308)
  [4] ifg.run (PG:6)
  [5] irl.run (PG:2)
  [6] isj.run (PG:2)
  [7] java.util.concurrent.ThreadPoolExecutor.runWorker (ThreadPoolExecutor.java:1,167)
  [8] java.util.concurrent.ThreadPoolExecutor$Worker.run (ThreadPoolExecutor.java:641)
  [9] hbj.run (PG:102)
  [10] java.lang.Thread.run (Thread.java:920)
DefaultPool5[1] > >
These are obfuscated, but you can now deobfuscate them, and find out what method was responsible for ile.a getting called (it was because of isj.run!).
Putting it all together into a bash one-liner (with inspiration from Poor Man's Profiler for the /dev/zero trick to avoid sending EOF):
$ (echo "monitor where";
   echo "monitor cont";
   echo "stop at ile.a";
   cat /dev/zero) | jdb -attach localhost:8700
Comments ()