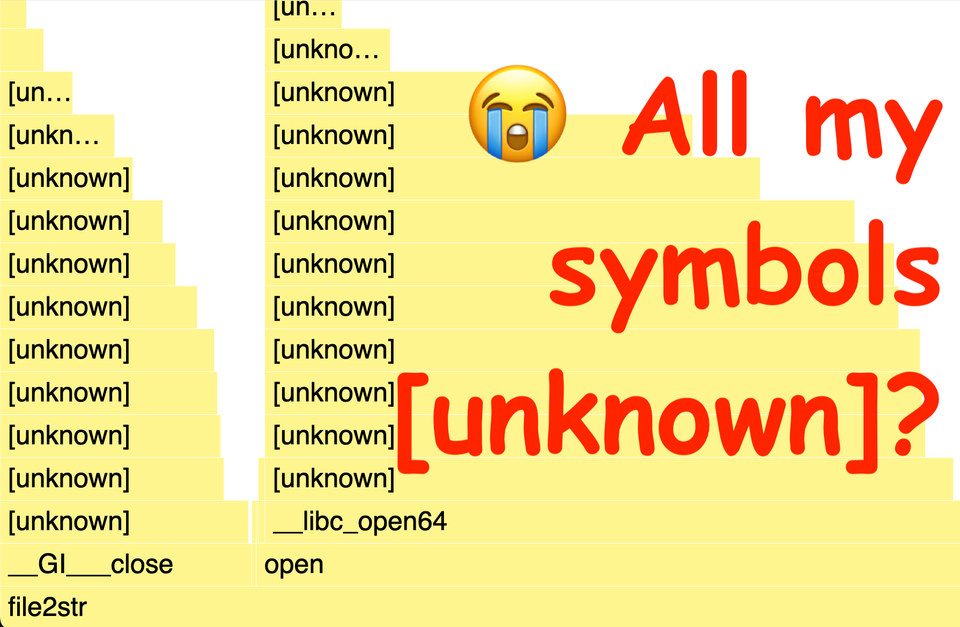
How to take performance profiles of Ubuntu/Debian apps (the ones from apt-get) so you can see full stack symbols, even in the kernel, without root.
How I backup my Google Photos, at full image quality, preserving GPS and timestamps, deduplicating identical images to save disk space.
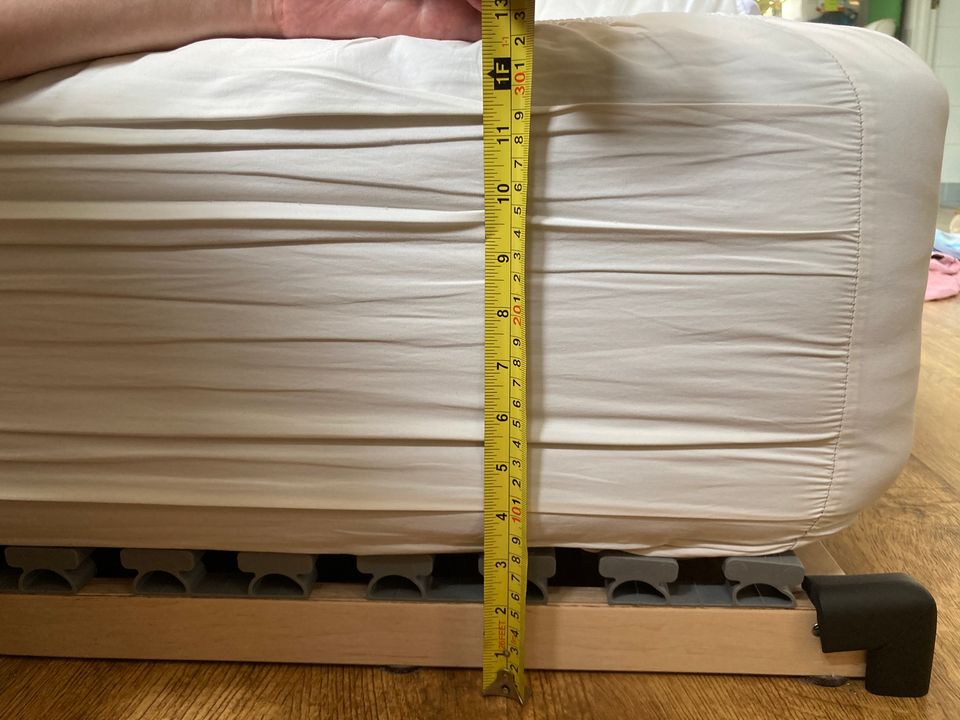
How we built a safer, lower floor bed for cosleeping with baby with the IKEA LÖNSET bed base
Debugging broken water sensor in my Beurer LB37 Humidifier, after it won't turn on, showing a red LED.
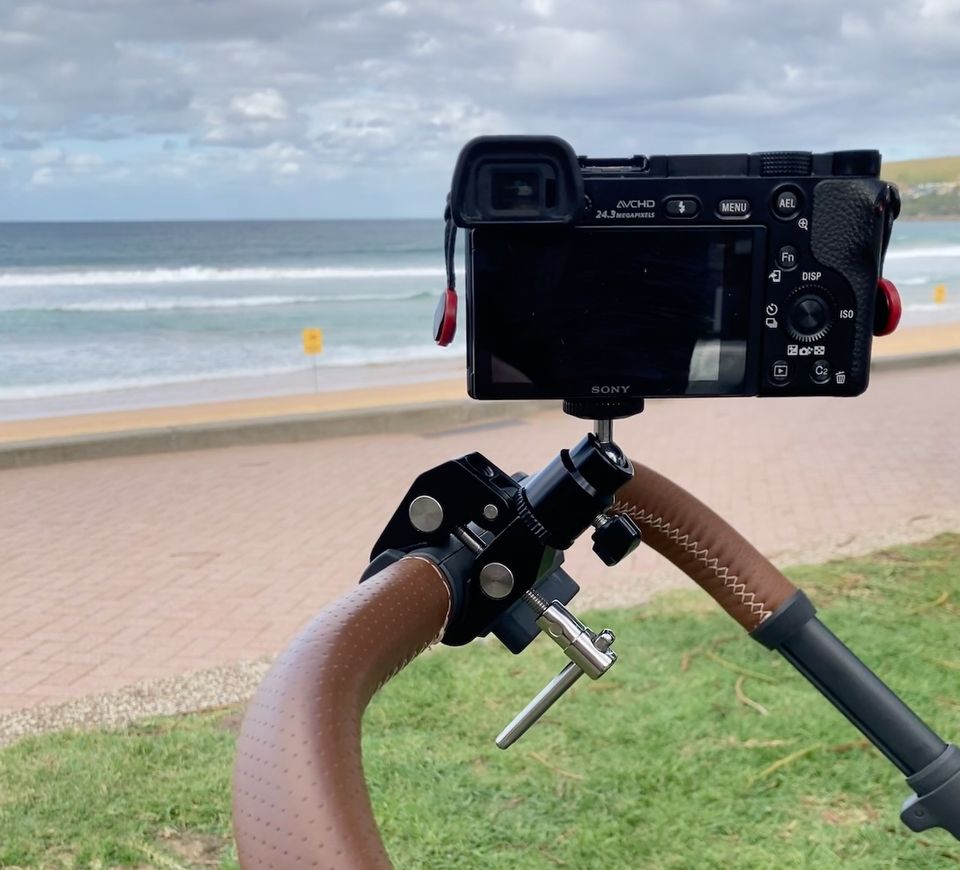
How to mount a heavy-ish mirrorless camera to a pram/stroller with a cheap clamp and ball mount.